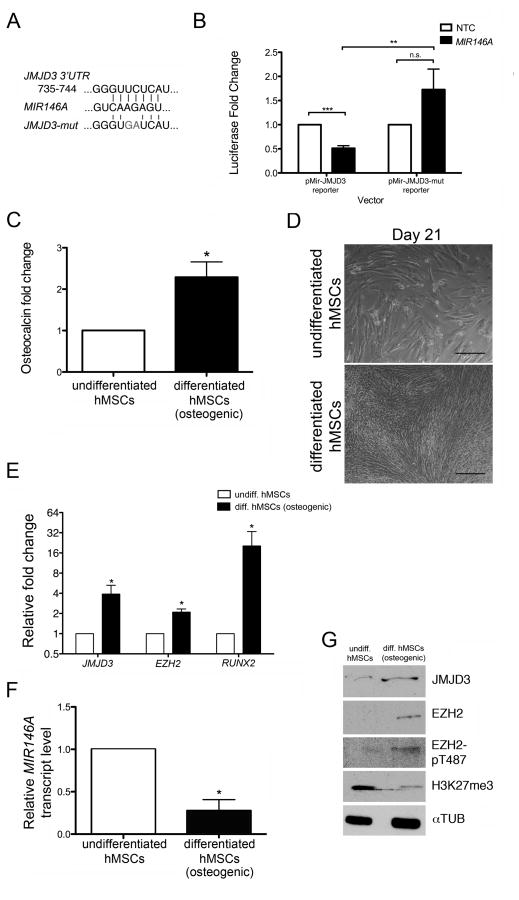
Figure 1. MIR146A targets JMJD3 and is downregulated during hMSC differentiation.
(A) The nucleotide sequence of the MIR146A binding site within the JMJD3 3′UTR. A mutated version of the binding site (‘JMJD3-mut’) served as a negative control. (B) Plasmid vectors containing the luciferase gene coding region upstream of either the JMJD3 3′UTR (pMir-JMJD3 reporter) or the JMJD3-mut 3′UTR (pMir-JMJD3-mut reporter) were cotransfected with a MIR146A mimic or a non-targeting control (NTC) mimic into P19 cells. The fold change in luciferase activity following MIR146A transfection is shown relative to NTC transfection. (C) Osteocalcin concentration in the cell media was measured by ELISA. Relative osteocalcin levels are depicted as a fold change in differentiated hMSCs relative to undifferentiated hMSCs. (D) Brightfield images of undifferentiated (top) and differentiated (bottom) hMSCs at the end of a 21-day differentiation period. Scale bars = 40 μM. (E) Fold change in qRT-PCR transcripts of JMJD3, EZH2, and RUNX2 in differentiating hMSCs relative to undifferentiated hMSCs. All transcripts were normalized to GAPDH. (F) qRT-PCR of MIR146A in undifferentiated and differentiating hMSCs. MIR146A transcript levels were normalized to U6 snRNA. (G) Representative western blot showing protein levels of JMJD3, EZH2, EZH2-pT487, and H3K27me3. αTUB was used as a loading control. All graphs (B, C, E, F) exhibit the mean value ± SEM of 3 biological replicates. *P<0.05, ***P<0.001; statistical differences were calculated by Student’s t test.

