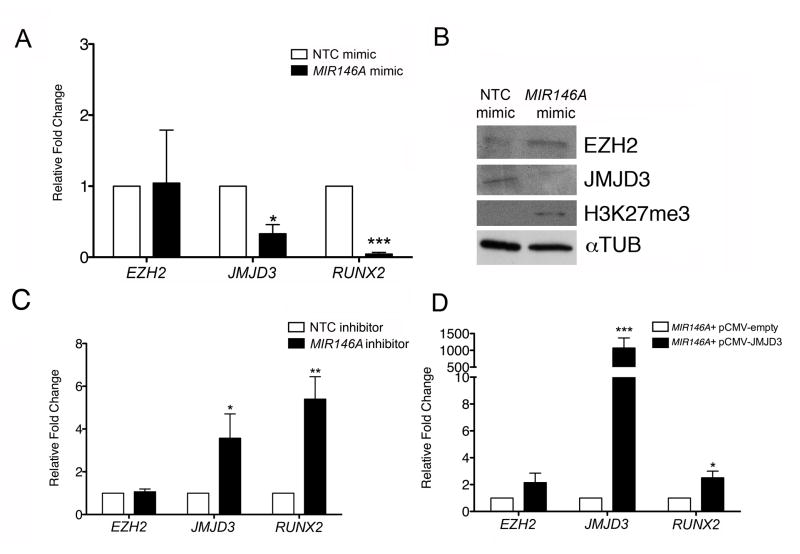
Figure 3. Modulation of MIR146A in hMSCs impacts osteogenic differentiation.
(A) Fold change in qRT-PCR transcripts of EZH2, JMJD3, and RUNX2 in MIR146A mimic-transfected hMSCs relative to NTC mimic-transfected hMSCs. All transcripts were normalized to GAPDH. (B) Representative western blot depicting levels of EZH2, JMJD3, and H3K27me3 in NTC mimic- and MIR146A mimic-transfected cells. αTUB was used as a loading control. (C) Fold change in qRT-PCR transcripts of EZH2, JMJD3, and RUNX2 in MIR146A inhibitor-transfected hMSCs relative to NTC inhibitor-transfected hMSCs. All transcripts were normalized to GAPDH. (D) Fold change in qRT-PCR transcripts of EZH2, JMJD3, and RUNX2 in differentiated hMSCs transfected with MIR146A mimic + JMJD3 expression construct pCMV-JMJD3 relative to differentiated hMSCs transfected with MIR146A mimic + control pCMV empty vector. All transcripts were normalized to GAPDH. All graphs (A, C, D) exhibit the mean value ± SEM of 3 biological replicates. *P<0.05, **P<0.01, ***P< 0.001; statistical differences were calculated by Student’s t test.

