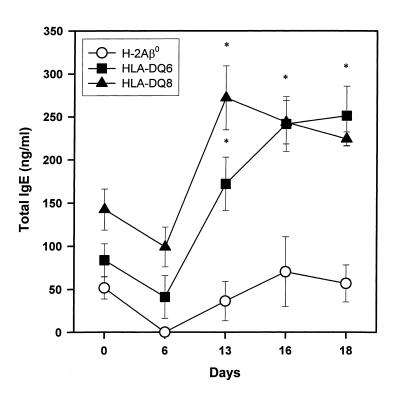
Figure 10.
Changes in serum concentration of total IgE induced by SRW treatment in H-2Aβ0, HLA-DQ6, and HLA-DQ8 mice. Serum samples were analyzed for IgE content by ELISA. Results shown here are from a single experiment representative of 3 experiments and are expressed as mean ± SEM (n = 4 for each experimental group). *P < 0.02 compared with IgE concentration in preimmune sera (day 0).

