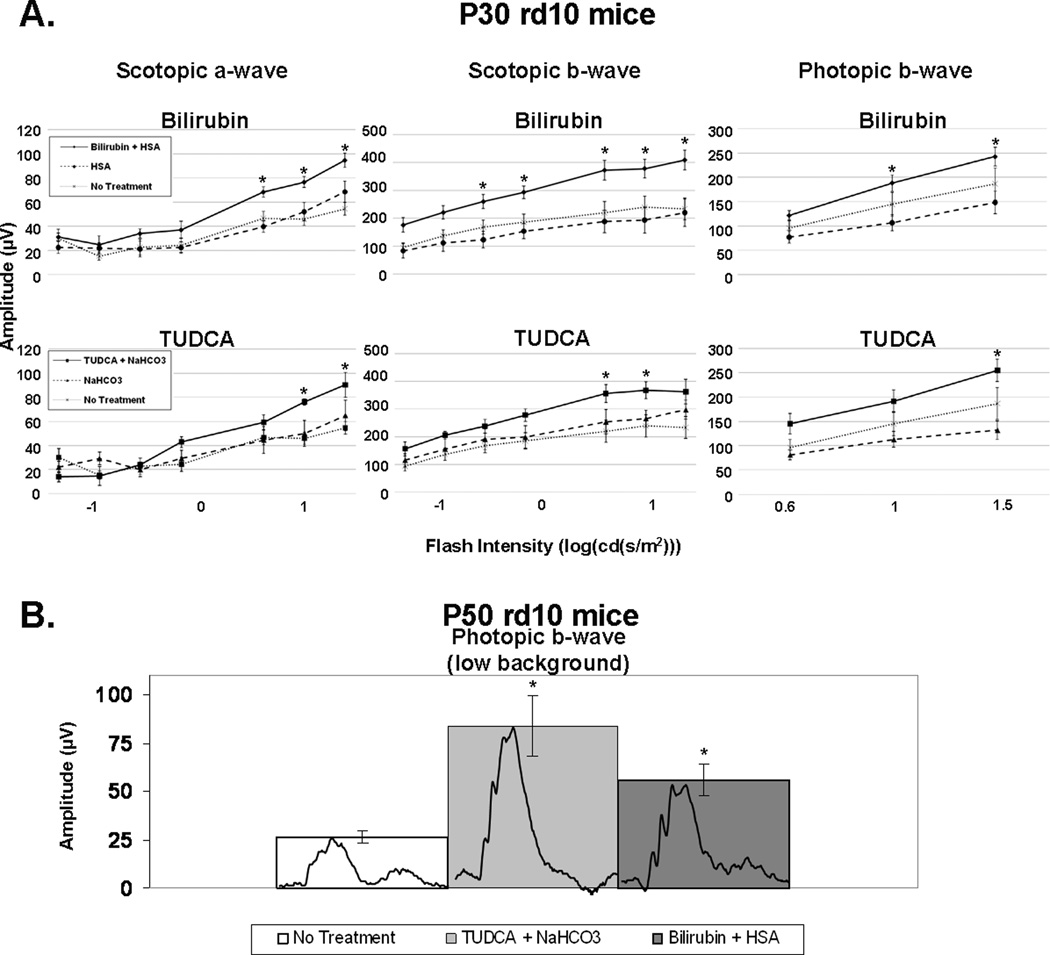
Figure 3. Bilirubin and TUDCA slowed the decline of photoreceptor function in rd10/rd10 mice.
Rd10/rd10 mice were given subcutaneous injections of bilirubin (5 mg/kg) or its HSA vehicle, TUDCA (500 mg/kg) or its NaHCO3 vehicle, or no injection every 3 days starting at postnatal day (P) 6. Scotopic and photopic electroretinograms (ERGs) were performed at P30 and P50. The bars show mean (±SEM) ERG amplitudes. (A) At P30, scotopic a-wave amplitudes were significantly higher for bilirubin (n=10) compared to its vehicle (n=8) at the three highest stimulus intensities and TUDCA (n=6) was significantly higher at the two highest stimulus intensities compared to its vehicle (n=6). Scotopic b-wave amplitudes show a significant difference for bilirubin compared to its vehicle at the five highest stimulus intensities and TUDCA compared to its vehicle at two of the highest stimulus intensities. Photopic b-wave amplitudes at P30 show a significant difference for bilirubin compared to its vehicle at the two highest stimulus intensities and TUDCA compared to its vehicle at the highest stimulus intensity. There was no statistically significant difference between the bilirubin-treated mice and the TUDCA-treated mice at any stimulus intensity. There was no significant difference between any of the three control groups (HSA, NaHCO3, and no injection) at any stimulus intensity. *p<0.05 by unpaired student t-test for difference between treated mice and their respective vehicle-treated control group. (B) Photopic b-wave ERGs with low background light (10 cd*s/m2) at P50 show a significant difference for rd10/rd10 mice injected with either bilirubin (n=8), or TUDCA (n=6), compared to rd10/rd10 control mice (n=4) that received no injection. Representative wave forms are shown (inset) for the non-injected, bilirubin-treated, and TUDCA-treated rd10/rd10 mice. There was no significant difference between the HSA or NaHCO3 vehicle-treated rd10/rd10 mice compared to the rd10/rd10 mice that received no injection. *p<0.05 for difference from untreated control by ANOVA with Bonferroni correction for multiple comparisons.

