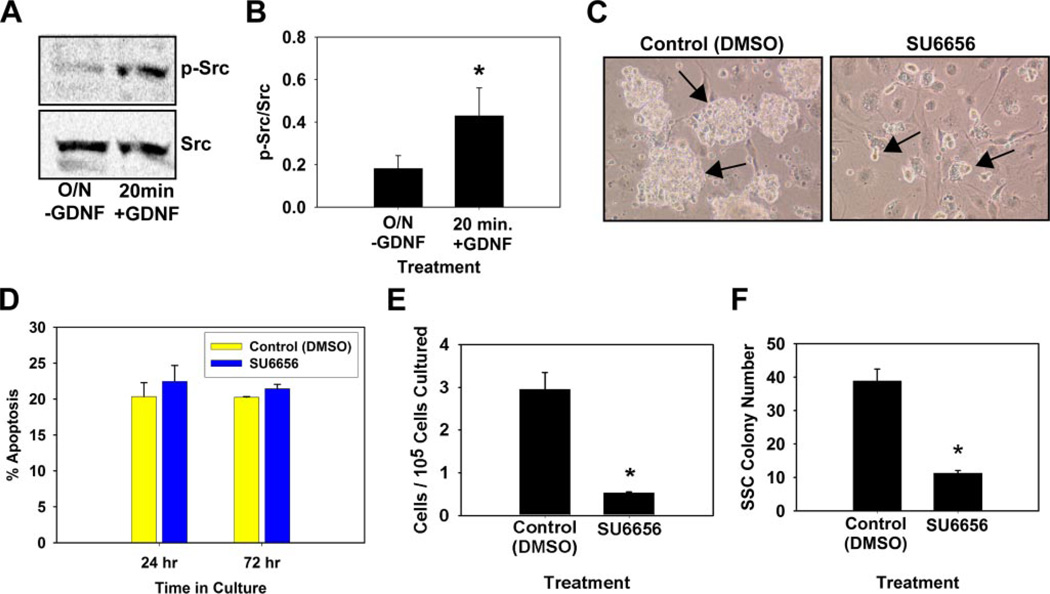
FIGURE 5. Evaluation of SFK signaling in SSC self-renewal in vitro.
A, representative image of immunoblot analysis for GDNF activation of SFK signaling in cultured self-renewing SSCs. Cultures were subjected to an 18-h withdrawal of GDNF (O/N-GDNF) followed by replacement for 20 min before cell lysis. Fifty µg of total cell lysate was resolved by SDS-PAGE, transferred to nitrocellulose membranes, and probed with a phosphorylated (p−) SFK antibody. Blots were then stripped and re-probed with an antibody for total Src levels. B, graphic representation of the ratio of phosphorylated SFK to total Src from three independent immunoblot experiments. Data are the mean ± S.E. Asterisks denote significant difference (p = 0.016). C, morphological observation of germ cell clump formation in vitro 7 days after addition of Me2SO (DMSO, Control) or 100 nm concentrations of the selective SFK inhibitor SU6656. Large robust germ cell clumps (arrows) formed in control cultures, whereas SU6656 cultures contained only small clumps of germ cells (arrows). Scale bars, 100 µm. D, percentage of apoptotic cells in clump-forming germ cell cultures 24 or 72 h after the addition of Me2SO (control) or 100 nm SU6656. Data are the mean ± S.E. of three independent experiments. E, total number of remaining cells 7 days after SU6656 (100 nm) treatment per 105 cells originally cultured. F, functional transplantation analysis of the effect of SU6656 treatment on SSC maintenance in vitro. Clump-forming germ cells were cultured for 7 days in conditions that support SSC self-renewal with the addition of Me2SO or 100 nm SU6656. Cells were subsequently transplanted into recipient testes to determine the number of SSCs present in each culture. SSC colony number is the number of colonies within recipient testes/105 cells cultured. Data are presented as mean ± S.E. for two independent experiments. Asterisks denote significantly different from control (p = 0.008).

