
Figure 2.
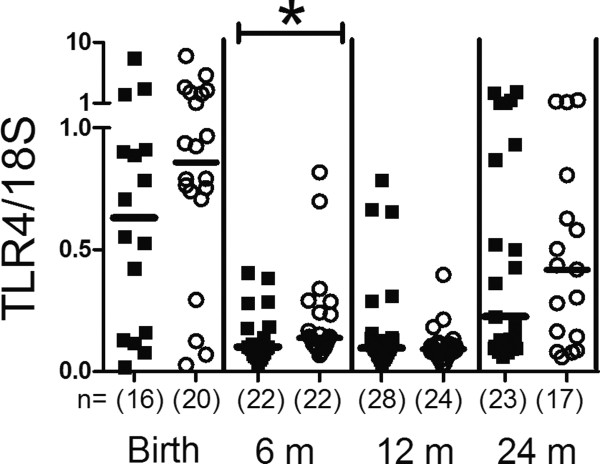
TLR4 mRNA expression. Comparison of TLR4 mRNA expression of peripheral blood mononuclear cells during the two first years in life in probiotic (filled squares) and placebo (open circles) treated children. The values represent TLR4/18S expression ratios. Groups were compared using Mann–Whitney U-test, *p < 0.05. The number of analysed samples is indicated (n), as well as the median values.