
Figure 3.
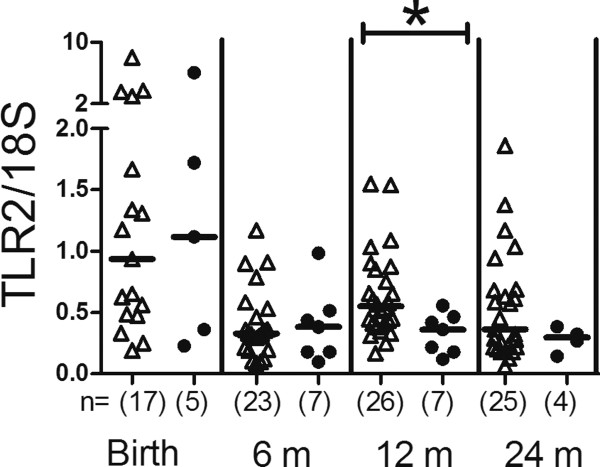
TLR2 mRNA expression. Comparison of TLR2 mRNA expression of peripheral blood mononuclear cells during the two first years in life in non-allergic (open triangles) and allergic children (filled circles). The values represent TLR2/18S expression ratios. Groups were compared using Mann–Whitney U-test, *p < 0.05. The number of analysed samples is indicated (n), as well as the median values.