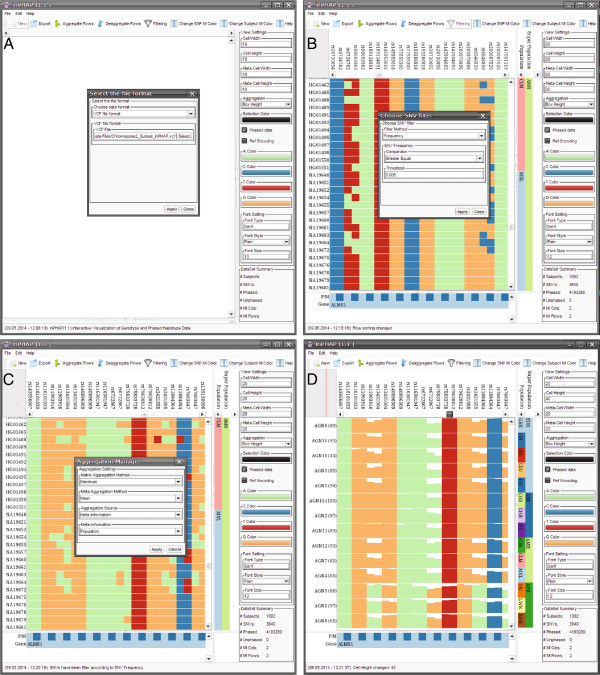
Figure 3.

Example workflow for the inPHAP tool, showing how data is loaded, processed and visualized using the inPHAP core features import, sorting, filtering and aggregation. A: The inPHAP graphical user interface after starting inPHAP and selecting “New” from the button menu on the top, in order to load a new data set in the VCF file format, B: View on the data, after loading a data set in the VCF file format and adding additional meta-information for individuals and SNVs in the data set. Rows have been sorted according to Population and Super Population by double-clicking the corresponding meta-information identifiers. “Filtering” from the button menu has been selected to initiate the filtering for SNVs with a frequency ≥ 0.5%, C: After filtering, the “Aggregate” button from the menu bar has been clicked to start aggregating the rows based on the provided meta-information. Here the population affiliation of the individual subjects is used for aggregation, D: Aggregated view on the filtered data set. In addition, zooming with the mouse wheel on the haplotype visualization was performed to increase cell height. The new height values are displayed in the settings panel.
