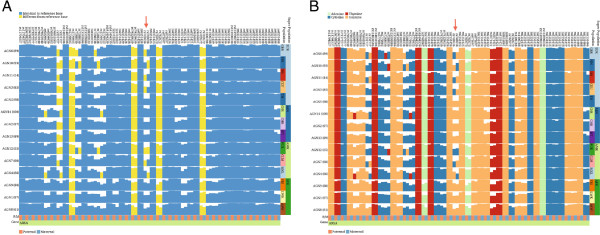
Figure 6.

Two inPHAP visualizations showing SNVs for the MLD associated gene ARSA. SNVs have been filtered based on their frequency across the 1096 individuals in the data set, showing only those SNVs with a frequency > 0.5%. Individuals have been aggregated according to their population affiliation (for abbreviations of the population names see Figure 2). Bar heights for each SNV display the frequency of the aggregated consensus base. The arrow points to the maternal allele of the central SNV with dbSNP ID rs743616 which is assumed to be one of the causative mutations leading to MLD. A: shows the selected SNVs using the reference- based visual encoding. Four of these SNVs show large differences to the reference base, which is shared across all populations, indicated by yellow bars ranging over a whole column, while some SNVs differing from the reference are restricted to few or even single populations, B: shows the selected SNVs using the nucleotide-based color encoding. In both visualizations differences between maternal and paternal alleles stand out clearly.
