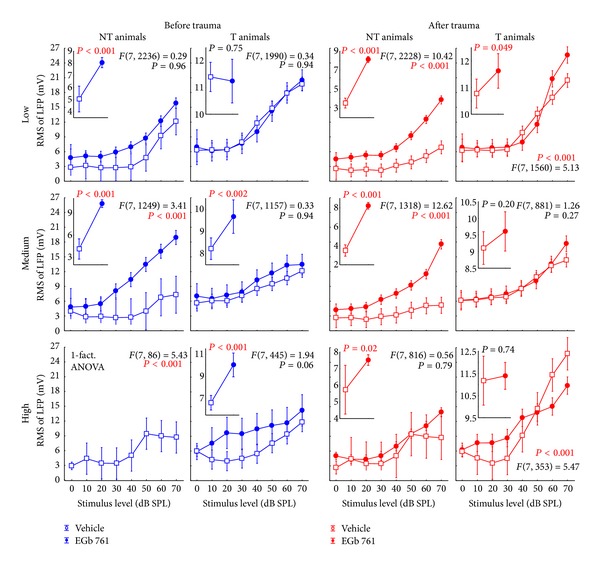
Figure 16.

Replotted data of Figure 9, grouped according to the time of measurement (before versus after trauma) to allow for an easier comparison of vehicle versus EGB 761 treated animals. Note the consistent differences in the LFP amplitudes, in particular in the NT animals in vehicle versus EGB 761 treated groups.
