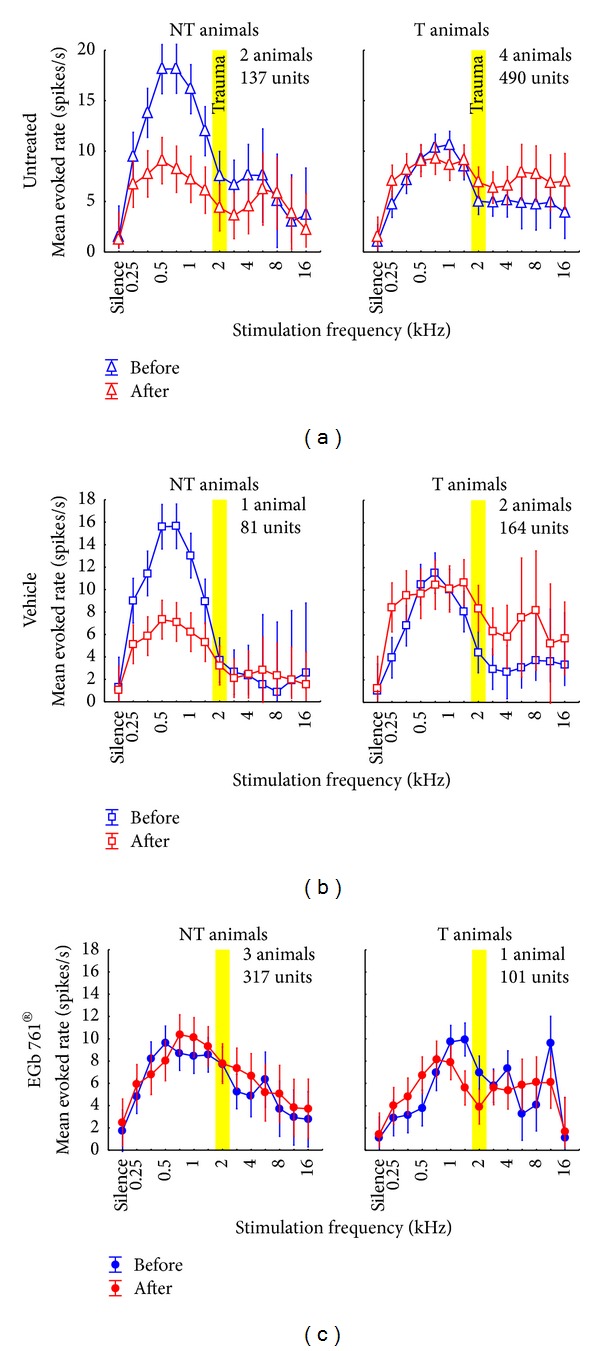
Figure 7.

Mean evoked neuronal response (±95% confidence interval) to iso-intensity pure tone stimulation across all recorded units in non-tinnitus and tinnitus perceiving animals. Animals that did not develop a tinnitus percept are grouped in the left column while animals that perceived tinnitus are shown in the right column. Depicted are the mean evoked rates (spikes/s) before (blue) and after (red) acoustic trauma at 2 kHz (yellow bar). (a) Data from untreated animals replotted from an earlier study [31]. 2-factorial ANOVA interaction F statistics: NT: F(13, 1866) = 3.12, P < 0.001; T: F(13, 5952) = 1.54, P = 0.10. (b) Data from vehicle treated animals. 2-factorial ANOVA interaction F-statistics: NT: F(13, 838) = 8.46, P < 0.001; T: F(13, 2772) = 1.42, P = 0.14. Note the similarity between these and the untreated animals in the NT as well as in the T group. (c) Data from EGb 761 treated animals showing clear differences to the other two animal groups. The 2-factorial ANOVA shows strong interaction of time of measurement (before versus after trauma) and stimulation frequency in the T (F(13, 1970) = 5.58, P < 0.001), but not in the NT group (F(13, 4420) = 0.86, P = 0.59).
