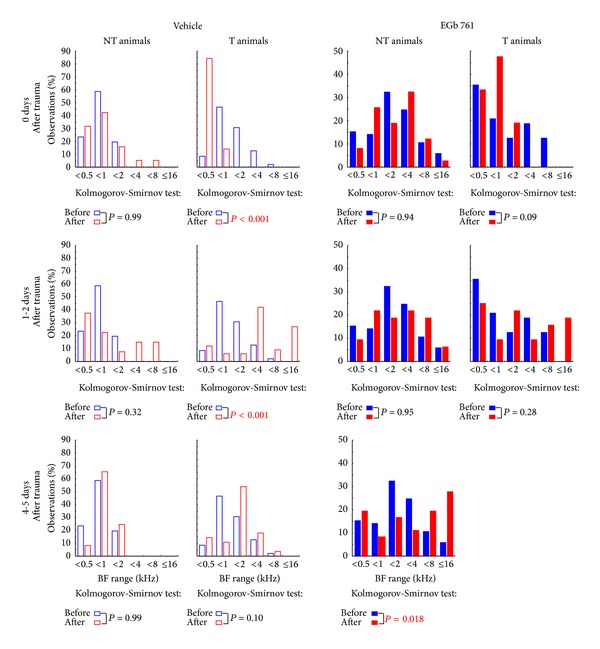
Figure 9.

Changes in BF frequency distributions over time. Shown are the comparisons of the frequency distributions of BF (observations in %) binned in one octave step of vehicle treated animals (left two columns) and EGb 761-treated animals (right two columns). Treated and untreated animal groups are further subgrouped into NT (first and third column) and T animals (second and fourth column) before the trauma (blue) with the data obtained during 3 different time points windows after trauma (red), from top to bottom: day of trauma, 1 to 2 days after trauma, and 4 to 5 days after trauma. The distributions are tested by Kolmogorov-Smirnov tests corrected for multiple comparisons. Note that we were not able to record from the single animal in the EGb 761 tinnitus group at days 4 to 5.
