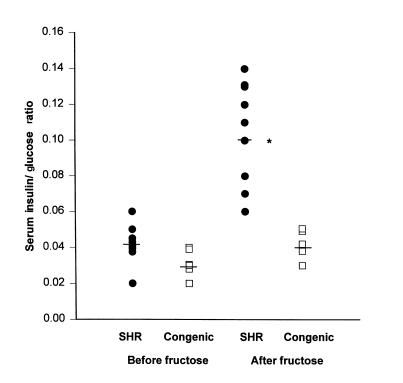
Figure 5.
Insulin/glucose ratios. Scatter plot showing serum insulin/glucose ratios in SHR progenitor rats (filled symbols; n = 9) and SHR.BN-Il6/Npy congenic rats (open symbols; n = 6) before and after 15 days on a high-fructose diet. Horizontal bars denote group means. After fructose feeding, insulin/glucose ratios were significantly greater in the SHR progenitor strain than in the SHR congenic strain (*P < 0.001).

