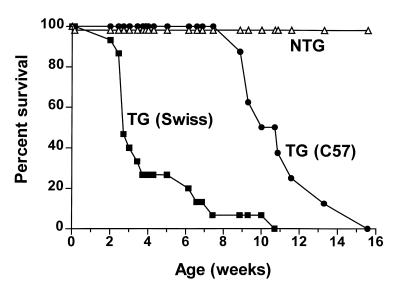
Figure 2.
Survival analysis of RhoA transgenic mice. F1 heterozygotes were generated by backcrossing the V12 founder mouse with either Black Swiss or C57BL/6 mice. The open triangles represent percent survival of nontransgenic (NTG) F1 mice (n = 55); the filled squares represent survival of transgenic (TG) V12 × Black Swiss F1 mice (n = 15); the filled circles represent survival of transgenic V12 × C57BL/6 F1 mice (n = 8).

