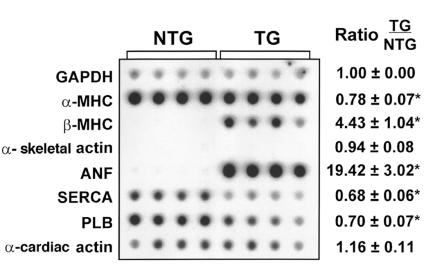
Figure 5.
Ventricular gene expression in RhoA transgenic mice. RNA isolated from ventricular tissue of nontransgenic (NTG) and transgenic (TG) mice was subjected to dot blot analysis using gene transcript–specific antisense oligonucleotide probes as indicated. A representative autoradiograph is shown, with each vertical column of 8 dots representing ventricular RNA from 1 animal. GAPDH was used as the normalizing control in each experiment and was unchanged between nontransgenic and transgenic samples. Consistent with our genotyping results, only RNA from RhoA transgenic mice showed intense hybridization with a RhoA probe (data not shown). The levels of each transcript in transgenic samples (right) were calculated as a ratio of the levels seen in nontransgenic mice, with a mean value of >1 representing induction and a value of <1 representing inhibition of gene expression in transgenic mice relative to nontransgenic mice. Data are presented as the mean ± SE (NTG: n = 7; TG: n = 7). *P < 0.05 TG vs. NTG.

