Figure 7.
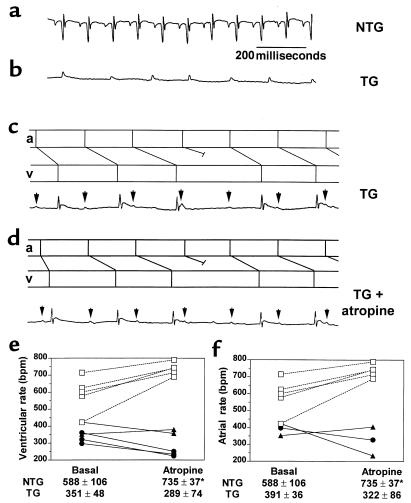
RhoA transgenic mice have slow heart rate and fail to respond to atropine. Representative ECG recordings from an anesthetized nontransgenic (NTG) mouse (a) and an anesthetized RhoA transgenic (TG) mouse with atrial fibrillation (b) or AV block before (c) and after (d) intraperitoneal atropine administration. All ECG tracings are to the same scale as indicated in a. In c and d, P waves are indicated by arrows; atrial (a) and ventricular (v) depolarizations are depicted in the ladder diagrams, as shown above each recording. Ventricular rates (e) and, where possible, atrial rates (f), were determined for nontransgenic (open squares), wild-type RhoA transgenic (filled circles), and constitutively activated RhoA transgenic (filled triangles) mice at basal conditions and following intraperitoneal atropine administration. Ventricular rates (NTG: n = 5; TG: n = 5) or atrial rates (NTG: n = 5; TG: n = 3), presented as mean ± SD for each condition, are indicated below the respective graphs. *P < 0.02 atropine vs. basal.

