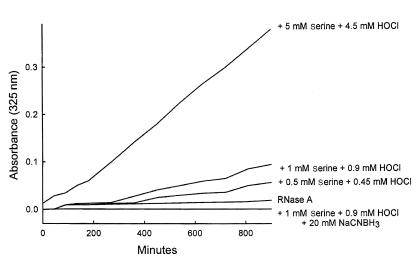
Figure 1.
Progress curve of protein browning induced by the HOCl-serine system. HOCl and L-serine (0.9:1.0 mol/mol at the indicated final concentration) were incubated together in buffer A (50 mM sodium phosphate buffer [pH 7.0]) for 15 minutes at 37°C. RNase A (100 mg/mL in buffer A) was then added to a final concentration of 10 mg/mL, and the absorbance at 325 nm of the reaction mixture was monitored. When indicated, 20 mM NaCNBH3 was present during the reaction of HOCl and L-serine.

