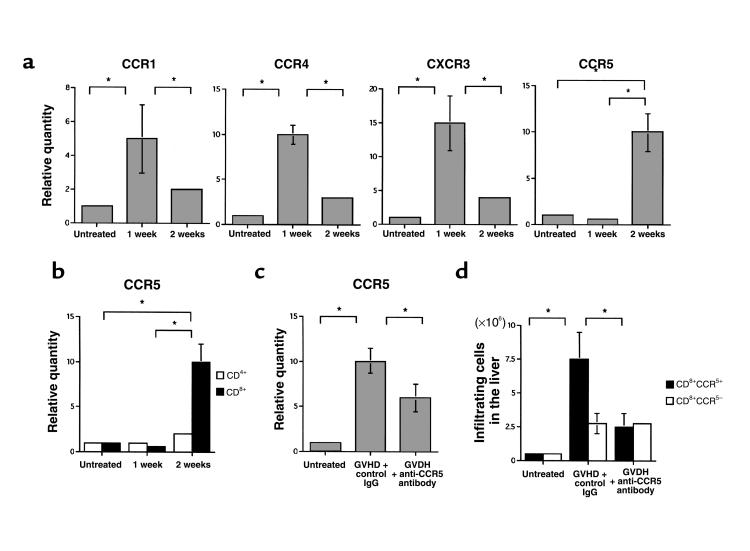
Figure 3.
(a) Kinetics of CCR1, CCR4, CXCR3, and CCR5 mRNA expression in liver CD8+ T cells. Sorted liver CD8+ T cells were prepared from untreated and GVHD-induced mice during the 2 weeks after parental cell transfer. The amounts of CCR1, CCR4, CXCR3, and CCR5 were normalized to the level of GAPDH at each time point. Each normalized chemokine receptor value from untreated liver-infiltrating leukocytes was designated as the calibrator, and final relative quantity of mRNA was expressed relative to the calibrator. PCR was performed in triplicate for each experiment. (b) Kinetics of CCR5 mRNA expression in liver CD4+ and CD8+ T cells. Sorted liver CD4+ (open bars) and CD8+ (filled bars) T cells were prepared from untreated and GVHD-induced mice during the 2 weeks after parental cell transfer. (c) Effect of anti-CCR5 antibody on CD8+ T cells in the liver. Relative quantity of CCR5 mRNA of sorted liver CD8+ T cells prepared from untreated mice and GVHD-induced mice treated with either anti-CCR5 antibody or control antibody, at the second week after induction. (d) The number of CCR5+CD8+ T cells (filled bars) and CCR5–CD8+ T cells (open bars) was determined by multiplying the total leukocyte number by the fraction of CD3+, CD8+, and CCR5+ cells and totaling the results. Liver-infiltrating leukocytes were prepared from untreated mice and GVHD-induced mice treated with either anti-CCR5 antibody or control antibody, at the second week after induction. For each graph, data represent the mean ± SD of 6 mice. Each graph is representative of the results obtained from 3 independent experiments. *P < 0.05.

