Figure 4.
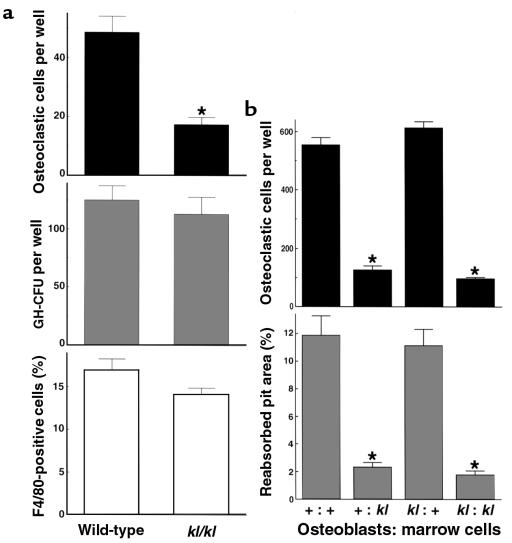
Osteoclastogenesis in ex vivo bone marrow cell cultures (a) and in the coculture of osteoblastic cells and bone marrow cells (b) from wild-type mice and kl/kl mice. (a) The number of TRAP-positive osteoclastic cells (top) and GM-CFU (middle) at 8 days of culture of bone marrow cells from 7-week-old wild-type or kl/kl mice. Data are expressed as mean (bars) ± SEM (error bars) for 8 and 6 wells per group, respectively. *Significantly different from wild-type cells (P < 0.01). The percentage of F4/80-positive monocyte macrophages in bone marrow cells was measured by flow cytometric analysis using FITC-labeled F4/80 (bottom). (b) The number of TRAP-positive osteoclastic cells formed at 8 days of coculture (top) and the pit area resorbed by osteoclastic cells by an additional 48 hours of culture on a dentine slice (bottom; percent of whole dentine). The origins (+ for wild-type mice and kl for kl/kl mice) of the cells are indicated as “Osteoblasts: marrow cells.” Data are expressed as mean (bars) ± SEM (error bars) for 8 wells per group. *Significantly different from wild-type cultures (P < 0.01).

