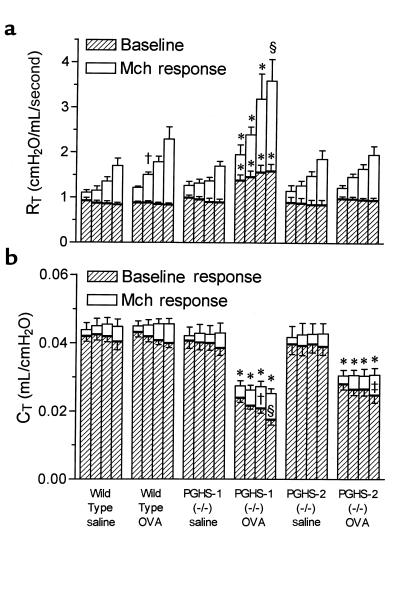
Figure 4.
Airway responsiveness to methacholine in PGHS-deficient and wild-type mice. Wild-type, PGHS-1–/–, and PGHS-2–/– mice were divided into treatment groups as described in Figure 1. Airway responses to intravenous Mch were measured 1 day after final aerosol exposure, as described in Methods. Bars represent mean ± SE of 7–13 mice per group. (a) RT before dosing with Mch and at peak of response to 25, 50, 100, and 200 μg/kg Mch (left to right for each group). For each dose, significant differences among groups were determined for associated baselines (shown above hatched bars) and increases in RT due to Mch (shown above open bars). *P < 0.05 vs. all other groups. †P < 0.05 vs. wild-type saline. §P < 0.05 vs. all groups except wild-type OVA. (b) Total respiratory system-compliance (CT), measured simultaneously with RT, before dosing with Mch and at nadir of response to Mch. For each dose, significant differences among groups were determined for associated baselines (hatched bars + open bars; shown above open bars) and decreases in CT due to Mch (shown within open bars). *P < 0.05 vs. wild-type saline, wild-type OVA, PGHS-1–/– saline, and PGHS-2–/– saline. †P < 0.05 vs. PGHS-1–/– saline and PGHS-2–/– OVA. §P < 0.05 vs. wild-type OVA and PGHS-1–/– saline. ‡P < 0.05 vs. PGHS-2–/– saline.

