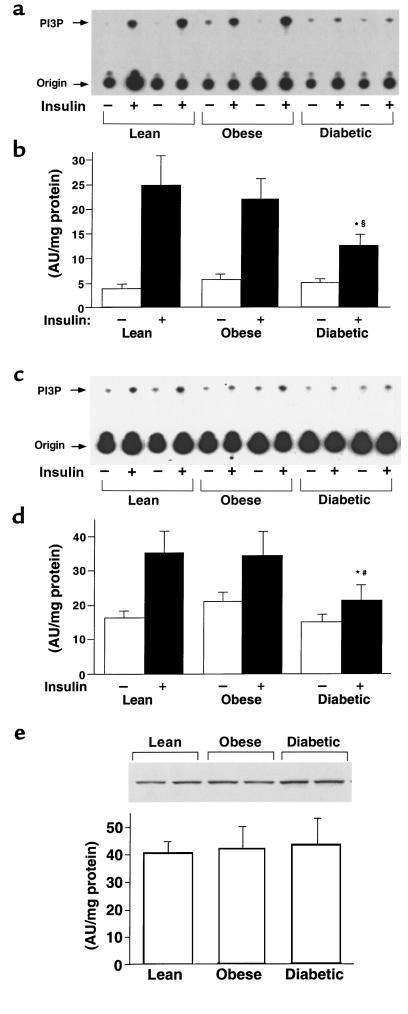
Figure 3.
IRS-1–associated (a and b) and IRS-2–associated (c and d) PI 3-kinase activity and p85 protein levels (e) in skeletal muscle of lean, obese nondiabetic, and obese diabetic subjects. All subjects underwent a 3-hour hyperinsulinemic, euglycemic clamp, and biopsies of vastus lateralis muscle were performed before and at the end of the clamp. (a and c) PI 3-kinase activity was measured in muscle lysates (500 μg) that were subjected to immunoprecipitation with an IRS-1 (a) or IRS-2 (c) antibody. The origin and position of phosphatidylinositol 3-phosphate (PI3P) are indicated on the left. Each lane contains a sample from a single subject; the basal (–) and insulin-stimulated (+) samples from each subject were loaded in adjacent lanes. The autoradiogram is representative of 3 independent experiments. (b and d) Quantitation of IRS-1–associated (b) or IRS-2–associated (d) PI 3-kinase activity in muscle using a PhosphorImager. Data are mean ± SEM for 6–12 subjects per group. *P < 0.05 vs. insulin-stimulated obese nondiabetic subjects. §P < 0.01 vs. insulin-stimulated lean subjects. #P < 0.05 vs. insulin-stimulated lean subjects. (e) Proteins in muscle lysates (100 μg) were separated by SDS-PAGE on 8% gels and transferred to nitrocellulose membranes. The p85 regulatory subunit of PI 3-kinase was visualized by immunoblotting with a p85α antibody, and levels were densitometrically quantitated. The autoradiogram is representative of 3 independent experiments. Each lane contains muscle from 1 subject; bars show mean ± SEM for 6–12 subjects per group.

