Figure 6.
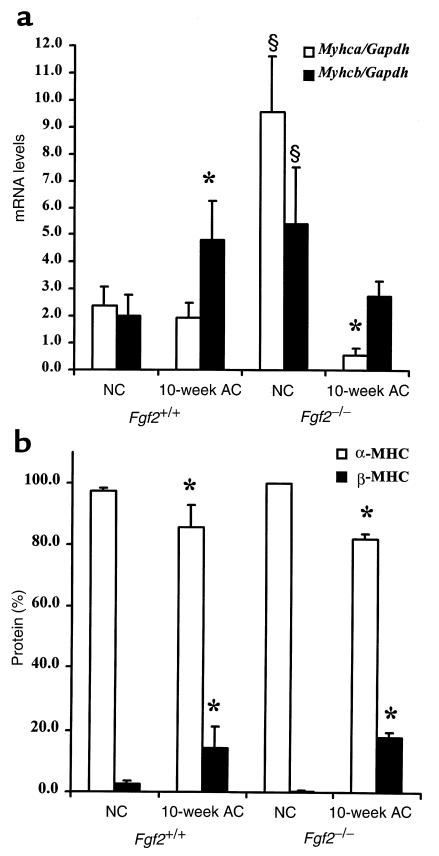
Expression pattern of MHC mRNA and protein levels in NC and 10-week AC Fgf2+/+ and Fgf2–/– mice. *P < 0.05 vs. NC. §P < 0.05 vs. NC Fgf2+/+. n = 4 for NC; n = 3 for AC Fgf2+/+ and Fgf2–/–. (a) Compared with NC Fgf2+/+, NC Fgf2–/– mice had a significantly higher degree of Myhca (α-MHC; open bars) and Myhcb (β-MHC; filled bars) message. Ten-week AC caused a significant increase in Myhcb mRNA expression and a significant decrease in Myhca in Fgf2+/+ and Fgf2–/–, respectively. (b) NC Fgf2+/+ and Fgf2–/– mice have similar levels of α-MHC (open bars) and β-MHC (filled bars) protein. Ten-week AC caused a significant decrease in α-MHC and a significant increase in β-MHC protein levels in Fgf2+/+ and Fgf2–/– mice.

