. 2014 Jun 11;3:e02598. doi: 10.7554/eLife.02598

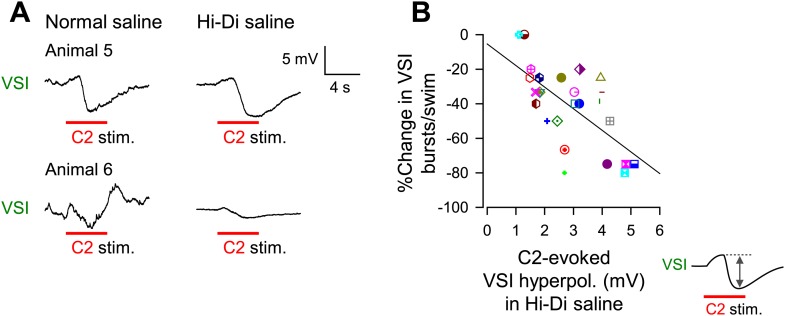
Figure 7. The extent of motor impairment correlated with the inhibitory component of C2-to-VSI synapse.

(A) Two examples (Animals 5 and 6) of VSI membrane potential responses to C2 stimulation recorded with PdN6 disconnected in normal saline (left) and in high divalent cation (Hi-Di) saline (right) to decrease the contribution of polysynaptic inputs. (B) The impairment, measured as the percent change in the number of VSI bursts, showed a significant correlation with the amplitude of the hyperpolarization phase (R2 = 0.44, p<0.001 by linear regression, N = 26) of the C2-evoked synaptic potential in VSI.

DOI: http://dx.doi.org/10.7554/eLife.02598.015

Figure 7—source data 1.
Source data for panel B.
elife02598s006.JNB (51.5KB, JNB)
DOI: 10.7554/eLife.02598.016
Figure 7—source data 2.
Source data for figure supplement 1.
elife02598s007.JNB (72.5KB, JNB)
DOI: 10.7554/eLife.02598.017

Figure 7.

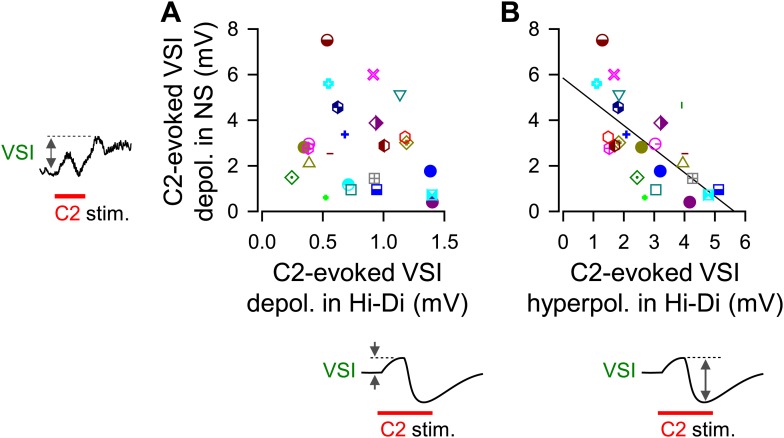
Figure 7—figure supplement 1. The magnitude of C2-evoked depolarization in VSI in normal saline correlated with the amplitude of hyperpolarizing phase of C2-to-VSI synaptic potential.

Figure 7—figure supplement 1.

The magnitude of C2-evoked VSI depolarization in normal saline did not correlate to the direct C2-evoked depolarization measured in Hi-Di saline (A, R2 = 0.04, p=0.37 by linear regression, N = 24), but did correlate with the C2-evoked hyperpolarization (B, R2 = 0.43, p<0.001 by linear regression, N = 24).