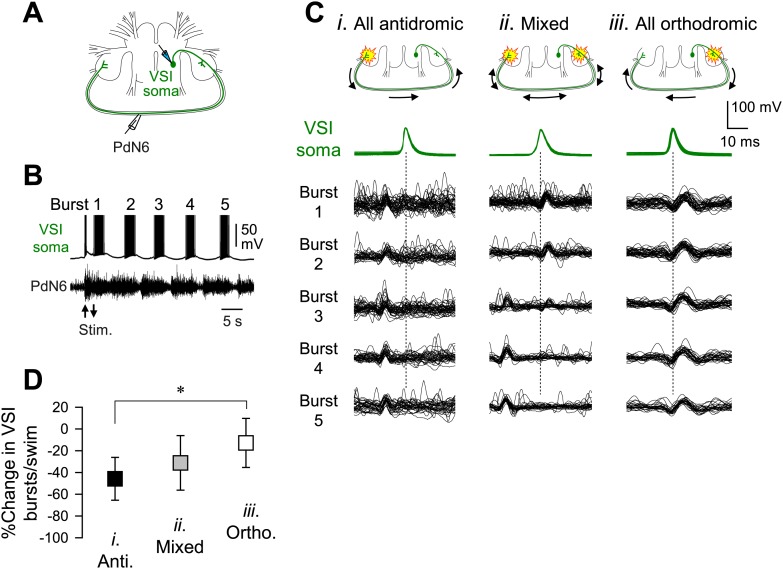
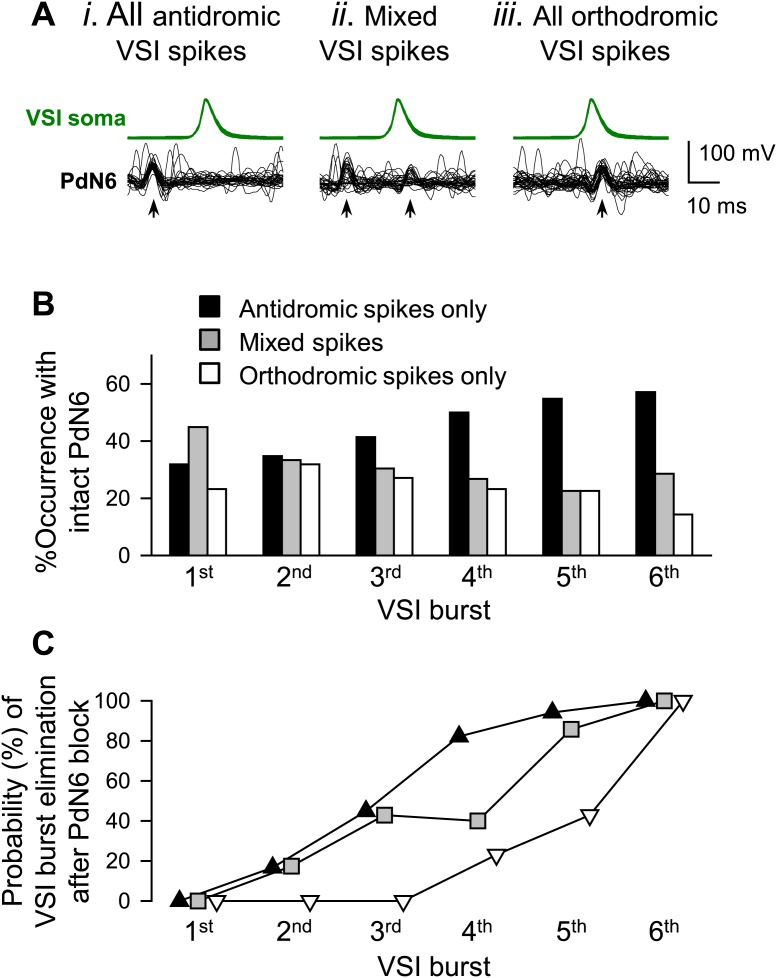
Figure 8. The direction of spike propagation in VSI axon was predictive of susceptibility of the swim motor pattern to PdN6 disconnection.
(A) A schematic diagram showing the recording configuration. VSI action potentials were recorded with an intracellular microelectrode in the soma and an extracellular en passant suction electrode on PdN6. To initiate a swim motor pattern, the left PdN3 was stimulated via a suction electrode (see Figure 3A). (B) Intracellular activity recorded from VSI and the axonal impulses recorded extracellularly from PdN6 during a swim motor pattern. Arrows indicate the time of PdN3 stimulation to initiate the swim program. Each VSI burst is indicated by a number (1–5). (C) Overlaid spike-triggered impulses for each burst recorded from PdN6 in three individuals show variability in the direction of VSI spike propagation (Ci, antidromic; Cii, mixed; Ciii, orthodromic). Schematic drawings above the traces show the presumptive spike-initiation zones (yellow explosion symbols) and the direction of action potential propagation (arrows) in the VSI axons. In Ci, all five bursts in the swim program consisted of antidromic VSI spikes (the nerve impulse appearing earlier than the soma spike), whereas in Cii, VSI spike propagation shifted from orthodromic to antidromic during the course of the swim motor pattern. In Ciii, all VSI spikes were evoked near the soma and propagated orthodromically. Traces in Cii were reused from Sakurai and Katz (2009b). (D) The direction of VSI spike propagation in PdN6 was predictive of the extent of impairment after PdN disconnection. The extent of impairment by PdN6 disconnection, shown as the percent change in the number of VSI bursts per swim episode, is plotted in three groups categorized by the direction of VSI spike propagations (black, all VSI bursts were antidromic; gray, mixed; white, all bursts were orthodromic). One-way ANOVA with a post-hoc pairwise comparison (Holm-Sidak method) revealed that individuals exhibiting only orthodromic VSI bursts were significantly less impaired than those with only antidromic VSI bursts as indicated by an asterisk (F(2,66) = 4.64, p = 0.015, N = 5 and 16).
DOI: http://dx.doi.org/10.7554/eLife.02598.019


