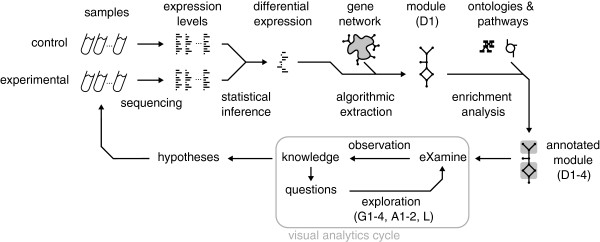
Figure 1.

Data and analysis pipeline. First, control and experimental samples are analyzed to estimate expression levels. Subsequently, gene expression differences (between experiment and control) and their significance are determined. These differences are then mapped to an interaction network, from which a module is extracted with overall significantly-differential gene expression. This module is annotated with overrepresented cell mechanisms from ontology and pathway databases. Finally, the enriched module undergoes iterative visual analysis via eXamine.
