Figure 2.

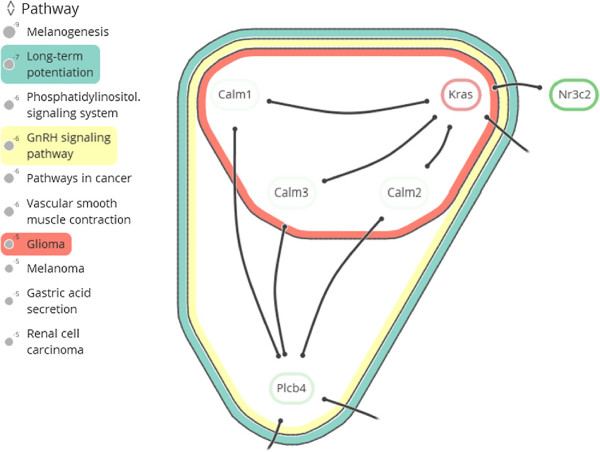
Visualization of an annotated module. Interacting proteins with a selection of three subsets, corresponding to overrepresented KEGG pathways. The visualization consists of a combination of a node-link diagram and an Euler diagram.

Visualization of an annotated module. Interacting proteins with a selection of three subsets, corresponding to overrepresented KEGG pathways. The visualization consists of a combination of a node-link diagram and an Euler diagram.