
Figure 3.
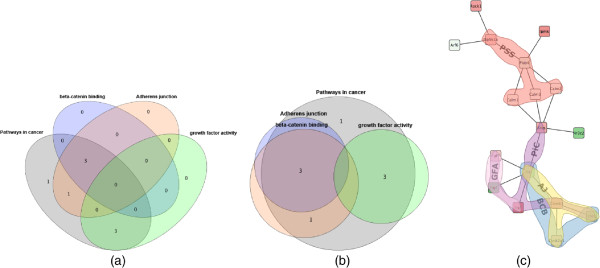
Comparison. Annotated module visualization using Cytoscape’s Venn and Euler diagram app: (a) Venn diagram and (b) Euler diagram. The number of displayed sets is limited to four and no network structure is shown. (c) Module laid out by one of Cytoscape’s built-in force-directed layout algorithms and BubbleSets superimposed on the network (same color scheme as in Figure 8(b)). Note that it is not immediately apparent that the nodes in the β-catenin set (blue) form a subset of Adherens junction (yellow), because the BubbleSet approach applies no explicit nesting of subsets.