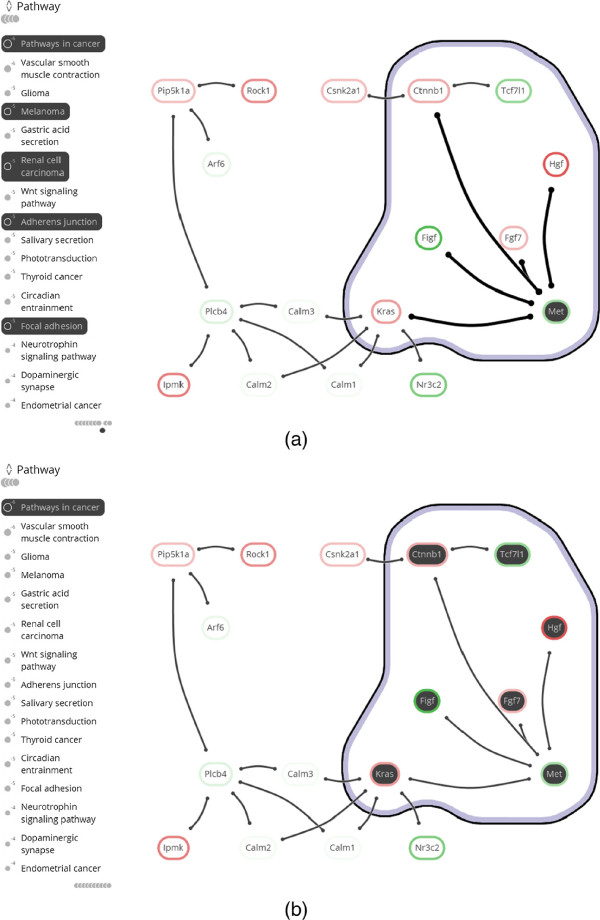
Figure 9.

Case study snapshots. Gene differential expression is shown as a colored box drawn around the node label (green for under-expression and red for over-expression). (a) The annotated module after tagging of the two familiar pathways Pathways in cancer and Phosphatidylinositol signaling system in C1 Two familiar pathways. (b) The annotated module after tagging functions Beta-catenin binding and Growth factor activity in C3 A twist of β -catenin and C4 Growing knowledge. (c) The fully annotated module, including annotation set overview, from which the hypothesis of C5 New insights is derived.
