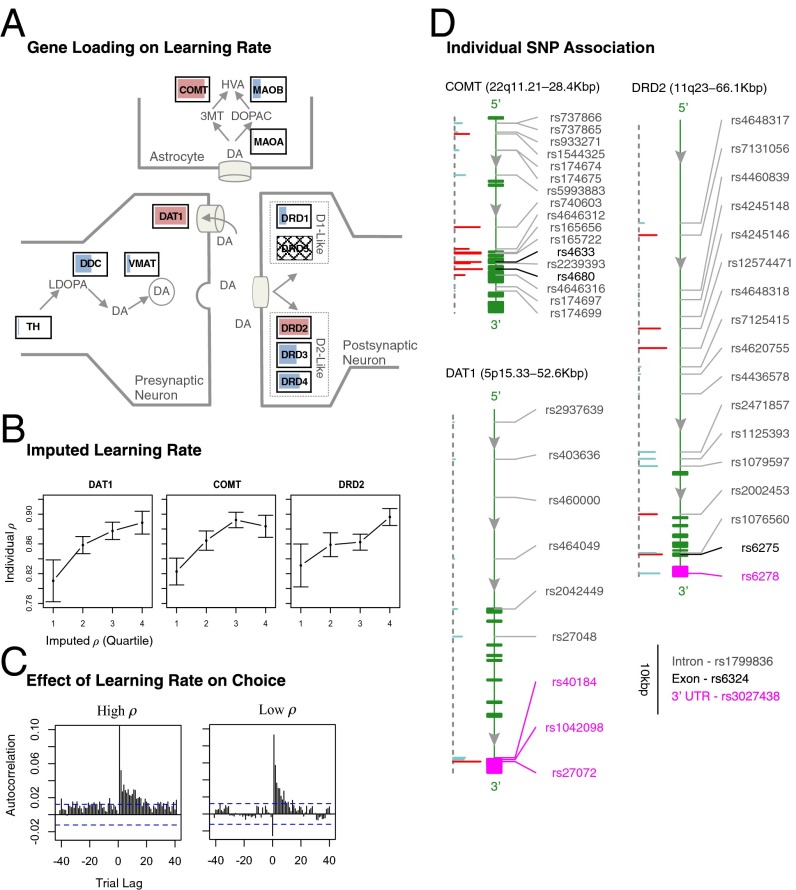
Fig. 4.
(A) Permutation tests showed significant association of DAT1, DRD2, and COMT with individual variation in learning rate (all P < 0.05). Color coding and interpretation are identical to Fig. 3A. (B) To capture how genetic variation affects the learning rate, we split gene-weighted values into quartiles and calculated the mean individual-level values (error bars are SEM). (C) Effect of genetic variation on choice behavior is illustrated using correlogram of investment level at time t with payoff deviation at time t± lag. The x axis represents different lags in number of rounds. Blue dashed lines indicate theoretical 95% confidence interval. Note the higher correlation values between periods 15–30 in high-ρ relative to low-ρ individuals. (D) Individual SNP associations for learning rate parameter ρ are shown on DNA strand. Color coding and interpretation are identical to Fig. 3D.

