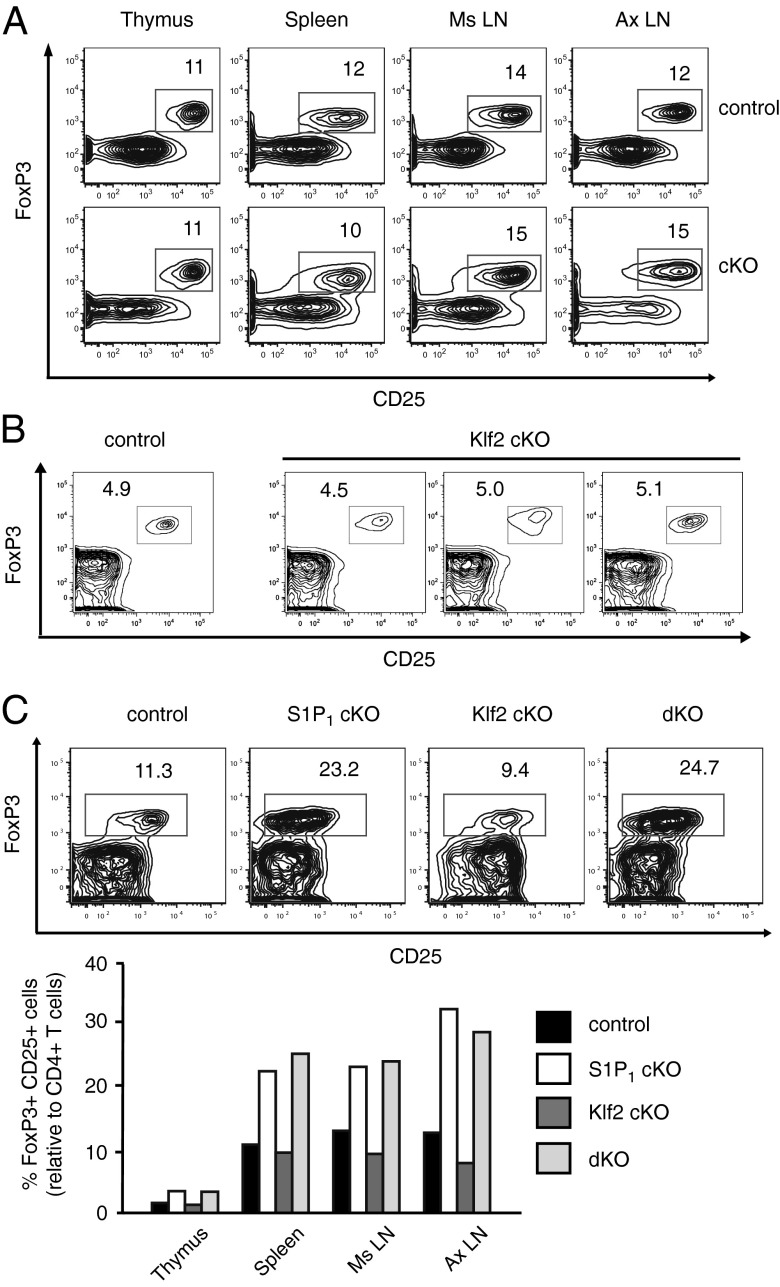
Fig. 1.
Treg frequencies in Klf2 gene-targeted mice. (A) Percent FoxP3+CD25+ Tregs relative to CD4+ T cells in tissues harvested from Klf2fl/fl (control) vs. Lck-cre; Klf2fl/fl (cKO) littermates (6 wk of age). This experiment was repeated four times. Ms LN, mesenteric lymph nodes; Ax LN, axillary lymph nodes. (B) Percent Tregs relative to CD4+ thymocytes in 3-wk-old Klf2fl/fl (control) or Lck-cre; Klf2fl/fl (cKO) littermates. This experiment was performed three times. (C) Proportion of Tregs present in Klf2fl/fl (control), Vav-cre; S1P1fl/fl (S1P1 cKO), Vav-cre; Klf2fl/fl (Klf2 cKO), and Vav-cre; S1P1fl/fl; Klf2fl/fl (dKO) littermates (n = 2 mice per group). FACS plots: flow cytometric analysis of CD4+ T cells in the spleen. % FoxP3+CD25+ Tregs are indicated. Bar graph: average frequency of Tregs relative to CD4+ T cells in lymphoid organs. Mice were 7 wk old. This experiment was repeated twice (excluding S1P1 cKO littermates, which were analyzed once).

