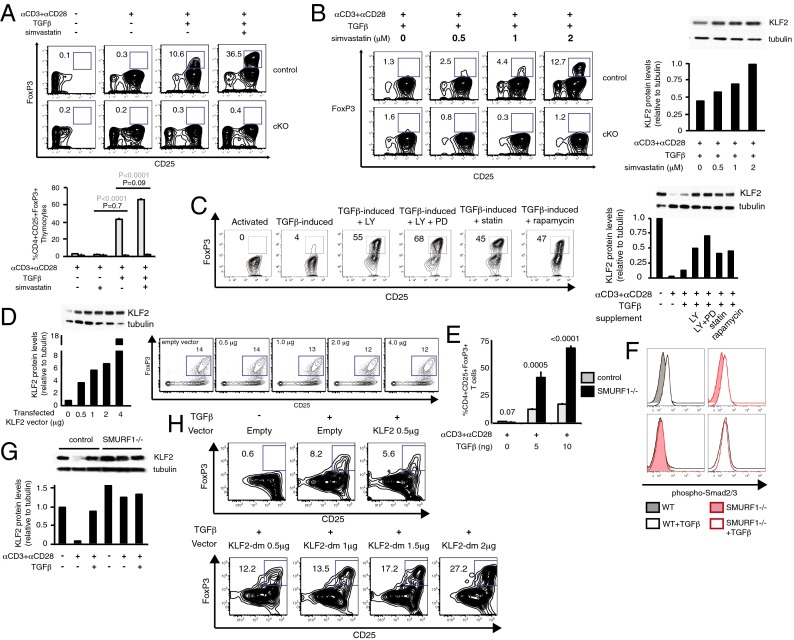
Fig. 5.
Increased KLF2 expression correlates with enhanced generation of iTregs. (A) Ex vivo generation of iTregs using CD4+CD25− T cells from Lck-cre (control) vs. Lck-cre; Klf2fl/fl (cKO) littermates in the presence of simvastatin. (Upper) Contour plots of iTregs (FoxP3+CD25+) after induction of splenic T cells. (Lower) Same assay performed in triplicate using CD4+CD8−CD25− thymocytes from control (gray) vs. cKO (black) mice. Statistical differences between control groups (gray numbers) and KLF2-deficient populations (black numbers) are shown. Both sets of experiments were repeated three times. (B and C) A comparison between iTreg induction and KLF2 protein levels. (B) (Left) FACS analysis of KLF2-replete (control) vs. KLF2-deficient (cKO) CD4+CD25− T cells cultured under suboptimal iTreg conditions with or without increasing concentrations of simvastatin. (Right) Immunoblots of KLF2/tubulin and corresponding densitometry plots using total cell lysate from CD4+CD25− T cells cultured (12 h) as specified. Both sets of experiments were repeated three times. (C) (Left) Contour plots of iTregs using wild-type CD4+CD25− T cells cultured with the indicated compounds (LY, LY294002; PD, PD98059; statin, simvastatin). Activated, αCD3 + αCD28; TGFβ-induced, αCD3 + αCD28 + TGFβ. (Right) Western blots of KLF2/tubulin and corresponding densitometry data from CD4+CD25− T cells cultured for 12 h under the specified conditions. These experiments were repeated four times. (D) iTreg production after transfection of wild-type CD4+CD25− T cells with KLF2 vector. Left panel: densitometry plot of KLF2 protein levels (relative to tubulin) 24 h after transfection with pcDNA-KLF2. (Right) Contour plots of T cells after KLF2 transfection (24 h, vector concentrations indicated) and 48 h iTreg induction. This experiment was repeated twice. (E) Quantification of ex vivo iTreg production using splenic CD4+CD25− T cells harvested from wild-type (gray bars) vs. SMURF1-deficient (black bars) animals. Error bars (SD) and P values are shown. n = 2 experiments, performed in triplicate. (F) Histogram overlays displaying Smad2/3 phosphorylation after TGF-β stimulation of CD4+CD25− T cells harvested from wild-type vs. SMURF1-deficient mice. This experiment was performed once, in triplicate. (G) KLF2/tubulin immunoblot and corresponding densitometry plot of 12-h cultured CD4+ T cells harvested from wild-type vs. SMURF1-deficient mice. This experiment was repeated twice. (H) Contour plots of CD4+ T cells after transfection [24 h with pcDNA3 (empty), pcDNA3-KLF2 (KLF2), or pcDNA3-KLF2-dm (KLF2-dm)] and 48 h iTreg induction. Percentages of iTregs are included. This experiment was repeated twice.

