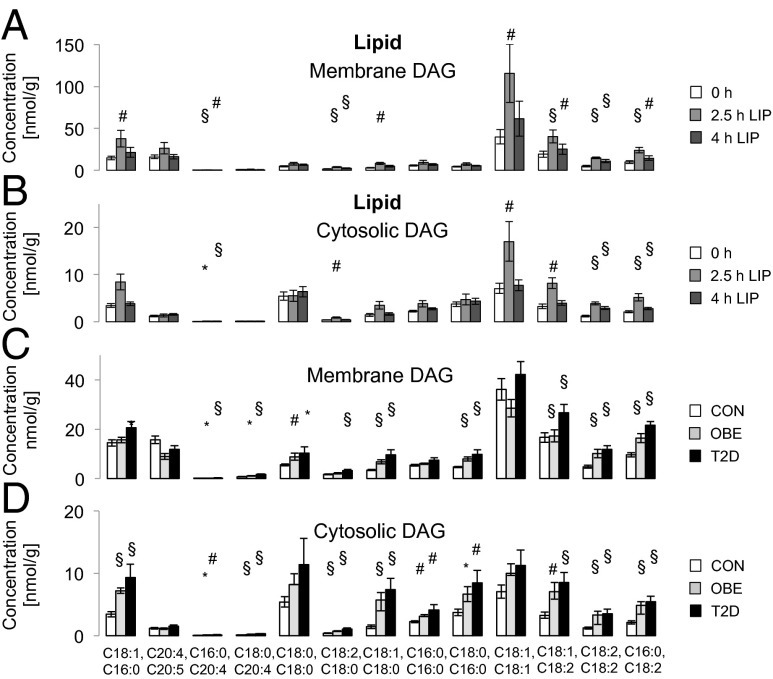
Fig. 2.
Concentration of membrane (A) and cytosolic (B) DAG species in healthy, lean controls (CON) (n = 16) at baseline (white columns), after 2.5 h (light gray columns), and after 4 h (dark gray columns) of lipid infusion. (C and D) Membrane (C) and cytosolic (D) DAG species concentrations in CON (white columns; n = 16), in young obese humans (OBE) (light gray columns; n = 10), and in elderly obese patients with T2D (black columns; n = 10). Data are given as means ± SEM. *P < 0.05; #P < 0.01; §P < 0.001 (2.5 or 4 h of lipid infusion vs. 0 h and OBE and T2D vs. CON).

