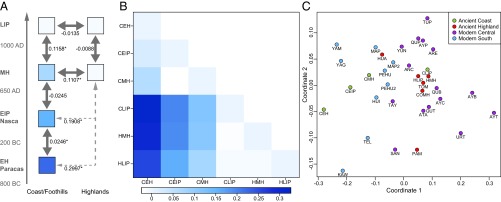
Fig. 2.

Genetic distances (pairwise FST) between the ancient populations from the RGND area and in comparison with other ancient and modern-day populations. (A and B) Genetic distances between the populations from the northern RGND. Significant FST values in A are marked with an asterisk, and increasing blue intensity on the heatmap indicates larger genetic distance (B). (C) The MDS plot is based on pairwise FST values and includes modern and ancient Andean populations (raw stress, 0.1088; names of populations are listed in Table S2).
