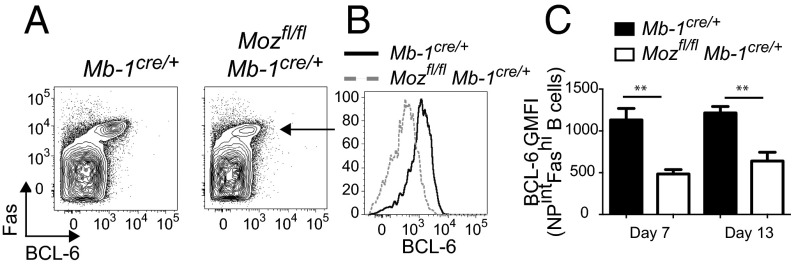
Fig. 3.
Reduced BCL-6 expression in the absence of MOZ. (A and B) Representative plots of BCL-6 expression versus Fas (arrow; A) in CD19+IgDlo cells, and BCL-6 expression in NP+FashiCD19+IgDlo cells (B), day 7 postimmunization. (C) Geometric mean fluorescence intensity (GMFI) of BCL-6 in NP+FashiCD19+IgDlo cells in Mb-1Cre/+ (black bars) and Mozfl/flMb-1Cre/+ (white bars). Data are combined from three (day 7) and two (day 13) experiments; n = 5–10 per genotype. Error bars indicate ± SEM. **P < 0.01.

