Fig. 8.
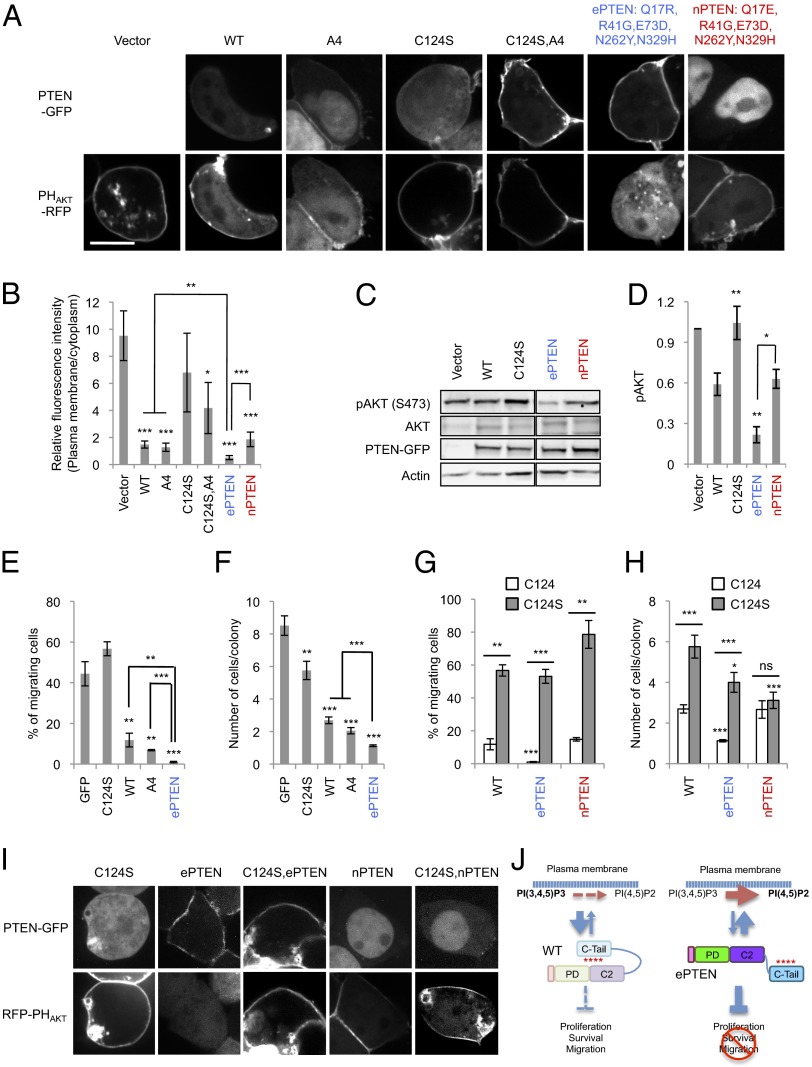
ePTEN-GFP (PTENQ17R, R41G, E73D, N262Y N329H-GFP) decreases PIP3 levels at the plasma membrane and suppresses cell migration and proliferation. (A) HEK293T cells expressing different PTEN-GFP constructs along with PHAKT-RFP were observed by fluorescence microscopy. (Scale bar, 10 µm.) (B) Intensity of RFP at the plasma membrane was quantified relative to that in the cytosol. Values represent the mean ± SD (n ≥ 8). (C) Whole-cell lysates expressing different PTEN-GFP constructs were analyzed by immunoblotting with antibodies against phospho-AKT, AKT, GFP (PTEN-GFP), and actin. (D) Band intensity was quantified (n ≥ 3). (E and G) MCF-10A PIK3CA cells were infected with lentiviruses carrying the indicated PTEN constructs and examined for cell migration, using transwell plates with pore size of 8 µm. Values represent the mean ± SD (n ≥ 3). (F and H) The number of cells in individual colonies was determined. Values represent the mean ± SD (n ≥ 20). (I) HEK293T cells expressing different PTEN constructs along with PHAKT-RFP were observed by fluorescence microscopy. (Scale bar, 10 µm.) (J) A model for ePTEN function.

