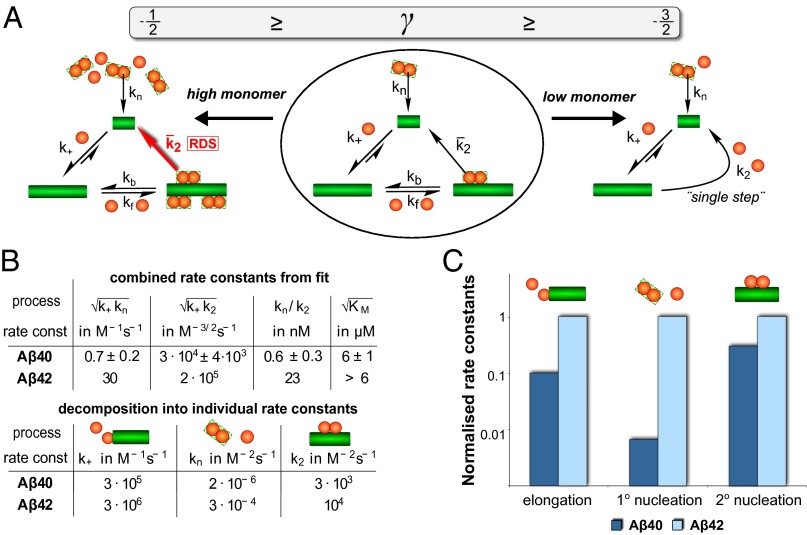
Fig. 3.
Rates and mechanistic differences between Aβ40 and Aβ42 aggregation. (A) Summary of the full reaction scheme. On the left and right, the limiting cases of high and low monomer concentration are shown. In low monomer conditions secondary nucleation is effectively single-step and in the high monomer limit the second step of the secondary nucleation process becomes rate-determining (RDS). Whereas both are relevant for Aβ40, only the low monomer behavior is observed for Aβ42. (B) Table of the combined rate constants obtained from the global fit and the individual microscopic rate constants of aggregation (in both cases n2 = nc = 2). The ratio kn/k2 describes the aggregate concentration above which secondary nucleation will be producing more nuclei than primary nucleation and shows that secondary nucleation is significantly more important than primary nucleation for Aβ40. The errors in the upper table were estimated by fitting different subsets of the replicates at each concentration; for details see Supporting Information, section 1.6. The elongation rate and hence all parameters in the lower table are only accurate to within a factor of 3 (Supporting Information, section 2.1). (C) Comparison of the individual rate constants of Aβ40 and Aβ42, normalized to the rate in Aβ42 and shown on a logarithmic scale. Note that the relative difference in rate constant is significantly larger for primary nucleation than for the other two processes.

