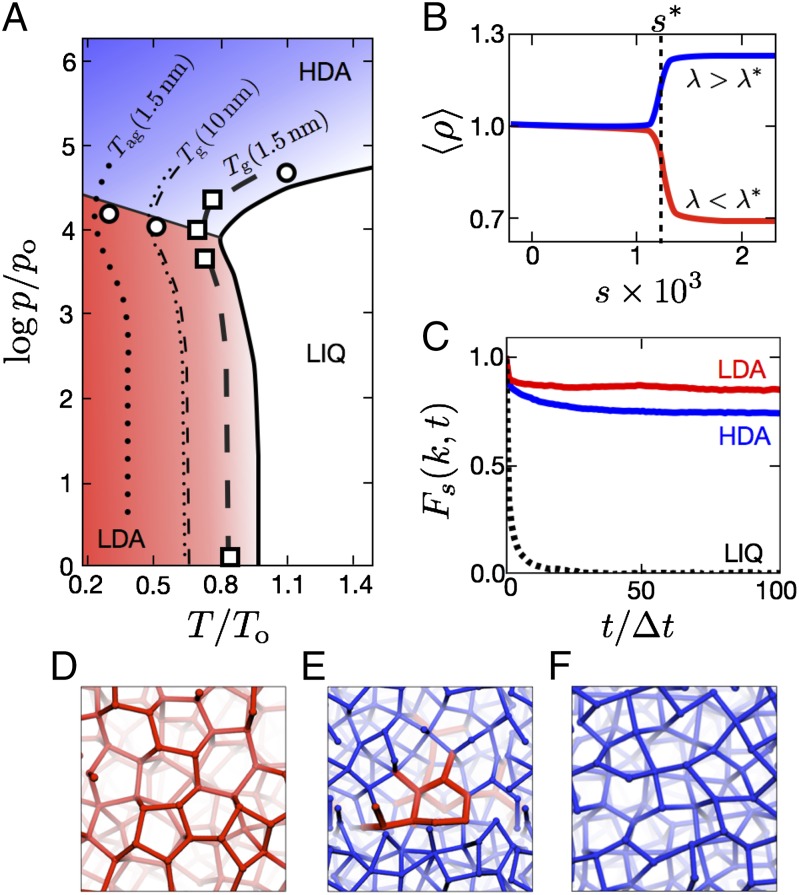
Fig. 1.
Liquid, LIQ, and nonequilibrium HDA and LDA solids. (A) Pressure–temperature phase diagram for water, with the liquid onset temperature line (solid), glass transition lines (dashed), and apparent glass transition lines (dotted). Squares locate points where nonequilibrium s-ensemble calculations locate coexistence between nonequilibrium phases in the mW model. Circles locate transitions observed in experiments (1, 8, 9) and in nonequilibrium relaxation simulations of the mW model. (B) The mean reduced density as a function of nonequilibrium control parameters computed for the mW model with the s ensemble near the nonequilibrium triple point. (C) Van Hove self-correlation functions for the three phases at the liquid’s principal wave vector k, all computed for the mW model at conditions near the nonequilibrium triple point. (D–F) Snapshots from simulations, where a bond connecting molecular centers i and j is colored according to the value of averaged over a second neighbor k (the quantity being defined below in Distinct Phases and Coexistence). The bond is red if this value is less than 0.1; otherwise, it is blue. A typical configuration of LDA ice is pictured in D, that of a domain of LDA ice in coexistence with HDA ice is in E, and that of HDA is in F.

