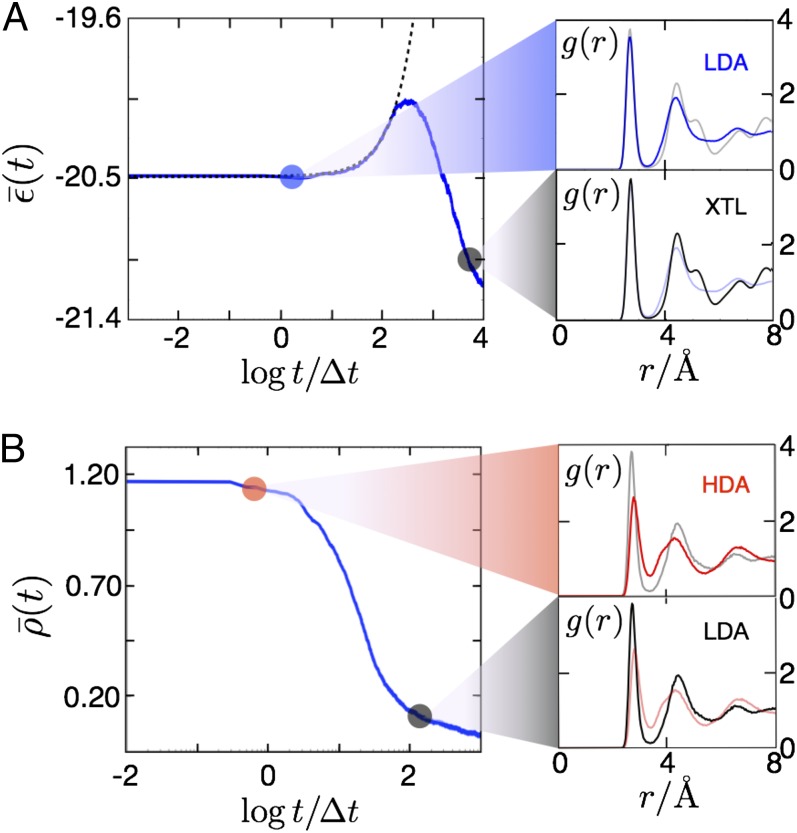
Fig. 3.
Relaxation behavior of amorphous ices produced with the s ensemble. (A, Left) Average potential energy per particle, in units of , as a function of time for the mW model prepared in an ensemble at , , , and and evolved with , , . The dashed black line is an exponential function with characteristic time, . (A, Right) Average pair distribution functions at two indicated points in time. Faint lines show the for the alternative solid. (B, Left) Average reduced density as a function of time for the mW model prepared in an ensemble at , , , and and evolved with , , . (B, Right) Average pair distribution functions at the two indicated points in time. Faint lines show the for the alternative solid.

