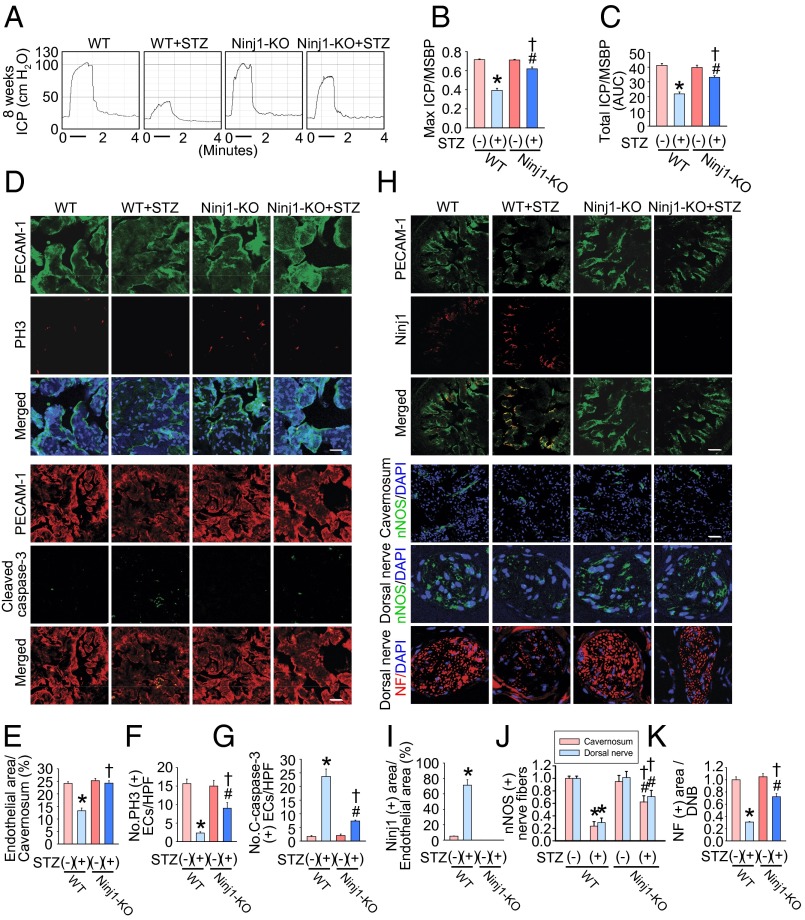
Fig. 7.
Ninj1-KO mice are resistant to diabetes-induced angiopathy and neuropathy and have restored erectile function. (A) Representative ICP responses for WT mice, WT mice receiving STZ, Ninj1-KO mice (Ninj1-KO), or Ninj1-KO mice receiving STZ. (B and C) Ratios of mean maximal ICP (B) and total ICP (C) (area under the curve) to MSBP were calculated for each group at 8 wk after the induction of diabetes (n = 6). *P < 0.001 vs. WT + STZ (−) group; #P < 0.01 vs. Ninj1-KO + STZ (−) group; †P < 0.001 vs. WT + STZ (+) group. (D) PECAM-1 (green) and phosphohistone H3 (PH3; red) or PECAM-1 (red) and cleaved caspase-3 immunostaining in each group. Nuclei were labeled with DAPI (blue). (Scale bars: PECAM-1-PH3 images, 25 µm; PECAM-1–cleaved caspase-3 images, 50 µm.) (E) Endothelial cell content in cavernous tissue was quantified using ImageJ. (F) Number of PH3-immunopositive endothelial cells per high-power field. (G) Number of apoptotic cells in endothelium per high-power field. *P < 0.001 vs. WT + STZ (-) group; #P < 0.001 vs. Ninj1-KO + STZ (−) group; †P < 0.001 vs. WT + STZ (+) group. (H) PECAM-1 (green), Ninj1 (red), nNOS (green), or neurofilament (red) immunostaining in each group. Nuclei were labeled with DAPI (blue). (Scale bars: PECAM-1-Ninj1 images, 100 µm; corpus cavernosum, 50 μm; dorsal nerve bundle, 25 μm. (I–K) Quantification of Ninj1 (I), nNOS (J), and neurofilament (K) in cavernous tissue or dorsal nerve bundle using ImageJ. Note there is no expression of endogenous Ninj1 in Ninj1-KO mice. *P < 0.05 vs. WT + STZ (−) group; #P < 0.05 vs. Ninj1-KO + STZ (−) group; †P < 0.05 vs. WT + STZ (+) group. The P values were determined by one-way ANOVA (B, C, E, F, and K), Kruskal–Wallis test (G and J), or Mann–Whitney u test (I). Data are mean ± SE. AUC, area under curve; C-caspase-3, cleaved caspase-3; DNB, dorsal nerve bundle; ECs, endothelial cells; NF, neurofilament.

