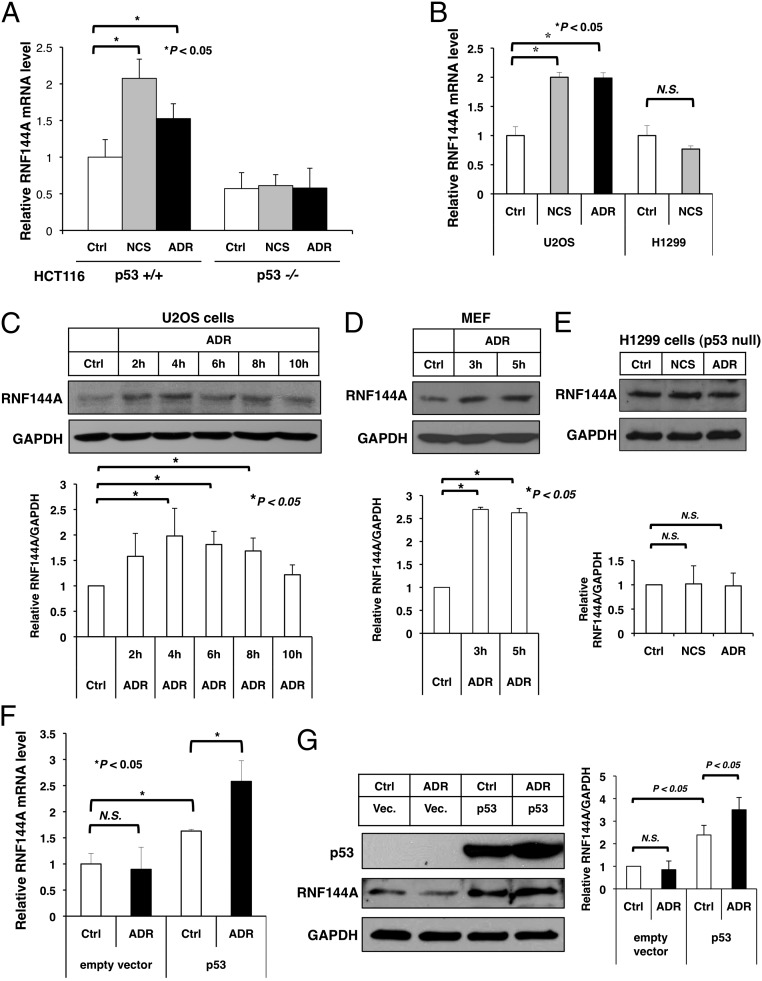
Fig. 1.
DNA-damaging agents induce the expression of RNF144A. (A and B) Real-time quantitative RT-PCR analysis shows that ADR and NCS induced the expression of RNF144A in (A) HCT116 p53+/+ and (B) U2OS cells but not (A) HCT116 p53−/− and (B) H1299 cells. Cells were treated with NCS (300 ng/mL) or ADR (10 μM) for 4 h. RNF144A mRNA level was determined by real-time RT-PCR in triplicate. Results were normalized to GAPDH levels and are expressed relative to the mock control (Ctrl) samples. (C–E) ADR induced RNF144A in (C) U2OS and (D) mouse embryonic fibroblast (MEF) but not (E) H1299 cells. Cells were treated with ADR (5 μM) for the indicated times, and RNF144A and GAPDH protein levels were determined by Western blot analysis. Quantitation of Western blots by ImageJ software from two to four independent experiments is shown in C–E, Lower. (F and G) Reexpression of p53 restored ADR-mediated induction of RNF144A mRNA in p53-null H1299 cells. An empty vector or p53 was transfected into H1299 cells. After 24 h, the cells were either mock-treated (Ctrl) or treated with ADR (10 μM) for 4 h. RNF144A mRNA level was determined by real-time RT-PCR in triplicate. (F) Results were normalized to GAPDH levels and are expressed relative to the empty vector mock-treated samples. (G) RNF144A and GAPDH protein levels were determined by Western blotting, and the signal intensity was quantified using ImageJ software. The relative RNF144A levels (normalized by GAPDH signals) from two independent experiments are shown as a graph in G, Right. Error bars represent SDs. *Significant difference with P < 0.05 (two-tailed t test). N.S., not significant.

