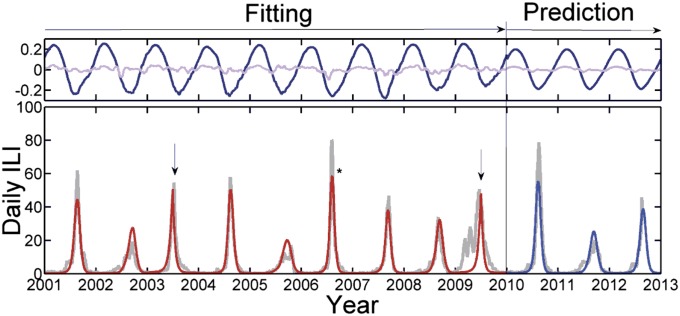
Fig. 1.
(Lower) The smoothed daily ILI cases reported in Tel Aviv (light gray), with June 1 indicated on the x-axis for each year. Time series from the climate-driven deterministic SIRS model fitted to the ILI data (2001–2010) is shown (red), with fit correlation r = 0.94 to the period leading up to the pandemic in 2009. (Upper) The climate data consist of centered, normalized daily temperature (dark blue) and relative humidity readings (light violet), both scaled according to estimated weight. The pure prediction from June 1, 2010 is driven by the average climate of all years with fit r = 0.93. The outbreaks dominated by influenza B are indicated, and the asterisk highlights the abnormally high amplitude of 2006–2007. The epochal jumps in antigenic drift are indicated with arrows.

