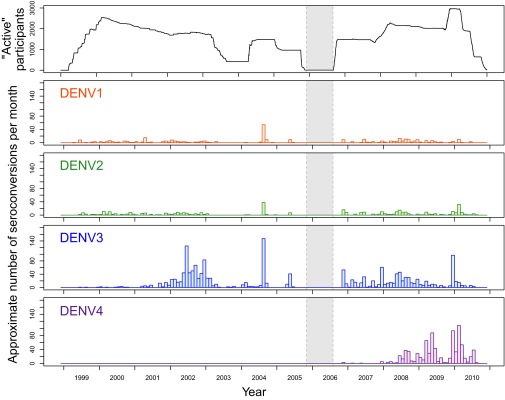
Fig. 1.

Summary of participants and interval-censored infections. The top panel shows the total number of active participants across cohort studies from 1999 to 2010. The absence of a cohort study from late 2005 to mid-2006 is indicated by the gray shaded region. Remaining panels: After applying the seroconversion identification algorithm to the raw data the number of interval censored infections are plotted against time. For all, the midpoint of the interval over which the infection was censored is used to time infections.
