
Fig. 3.
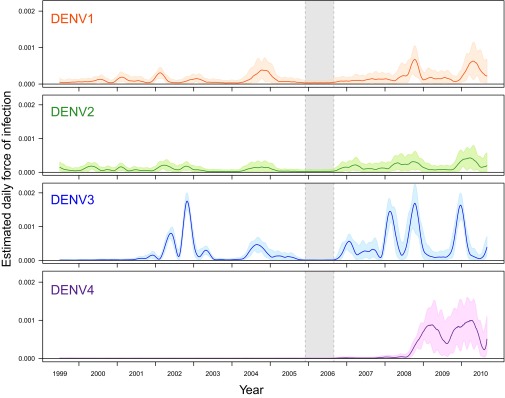
Daily estimates of FoI. For each serotype, daily estimates of FoI as well as the 90% BCI are plotted against time. The absence of a cohort study from late 2005 to mid-2006 is indicated by the gray shaded region.
Official websites use .gov
A
.gov website belongs to an official
government organization in the United States.
Secure .gov websites use HTTPS
A lock (
) or https:// means you've safely
connected to the .gov website. Share sensitive
information only on official, secure websites.
Daily estimates of FoI. For each serotype, daily estimates of FoI as well as the 90% BCI are plotted against time. The absence of a cohort study from late 2005 to mid-2006 is indicated by the gray shaded region.