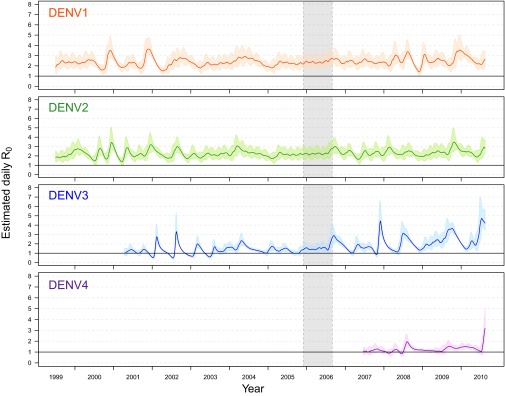
Fig. 5.

Daily estimates of . For each serotype daily estimates of as well as the 50% BCI are plotted against time. The absence of a cohort study from late 2005 to mid-2006 is indicated by the gray shaded region. The estimates for both DENV-3 and DENV-4 are truncated, excluding estimation before their respective introductions.
