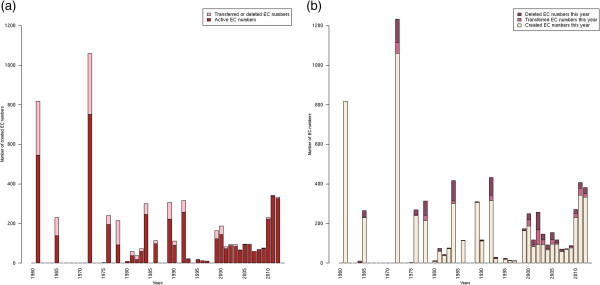
Figure 2.

EC classification evolution over years. (a) Snapshot of EC number status by year of creation. This barplot represents the number of created EC numbers over years and the proportion of nowadays active entries in red and transferred/deleted entries in pink. (b) Dynamics of the EC entry creations and status changes over years. This barplot represents the number of EC entry modifications over years: creation (yellow), transfer (light red) and deletion (dark red).
