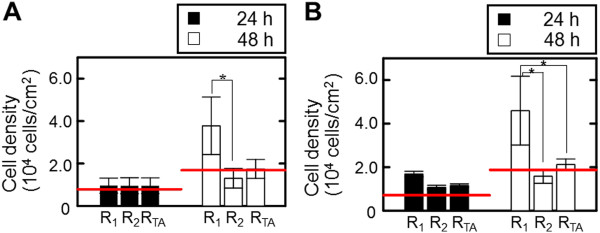
Figure 2.

Vertical spatial growth and distribution of epithelial cells cultured for 48 h on pillar (A) and pit (B) substrates. The red lines indicate the data determined on the flat unpatterned substrate. Data are measured from individual pillars and pits of 9. The bar shows the standard deviation obtained from triplicate measurements.
