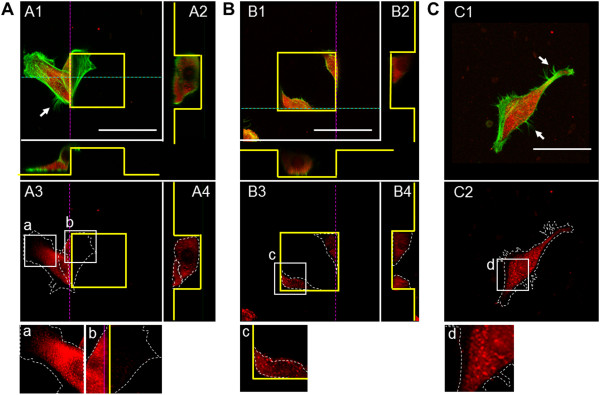
Figure 4.

Immunostaining of vinculin (red) and F-actin (green) for epithelial cells cultured on pillar (A), pit (B) and flat (C) substrates. The scale bars show 50 μm. The yellow lines outline the pillar or pit features. The white dotted lines indicate the formation of actin stress fibers. Panels A2, A4, B2, and B4 show the cross-sectional views (dotted pink and blue lines) of the images in panels A1, A3, B1, and B3, respectively. Panels a–d show merged enlargements of the corresponding boxed areas in panels A3, B3, and C2. The asterisks indicate the formation of filopodia.
