
Figure 2.
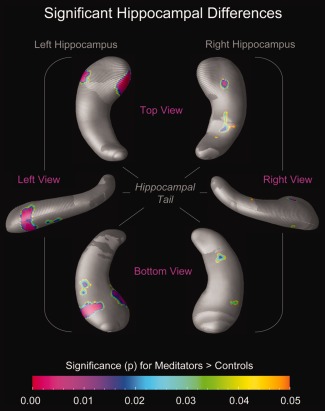
Significant hippocampal differences. The color bar encodes the significance of the group difference (P). Hippocampal maps illustrate significantly larger radial distances in meditators (P ≤ 0.05, uncorrected) compared with controls. Hippocampal regions in gray indicate where no significant group differences were observed (P > 0.05). Maps on the left display views of the left hippocampus (from the top; left; bottom); maps on the right display views of the right hippocampus (from the top; right; bottom). [Color figure can be viewed in the online issue, which is available at http://wileyonlinelibrary.com.]