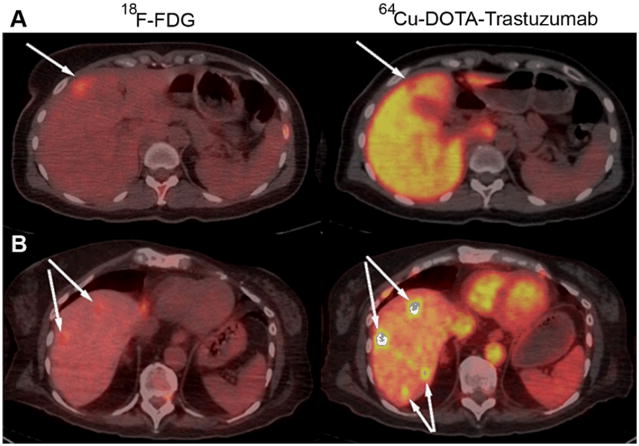
FIGURE 4.
Visualization of hepatic metastases. (A) Fused transaxial PET-CT images of 18F-FDG and 64Cu-DOTA-trastuzumab 21 h post injection for a patient (“Patient A”) given 5 mg of trastuzumab. Upper intensity thresholds (white color) correspond to SUV = 10 g/ml for 18F-FDG and 40 g/ml for 64Cu-DOTA-trastuzumab. (B) Fused transaxial PET-CT images of 18F-FDG and 64Cu-DOTA-trastuzumab 47 h post injection for a patient (“Patient B”) given 50 mg of trastuzumab. Upper intensity thresholds correspond to SUV = 10 g/ml. Arrows indicate detected lesions. For Patient A, an anterior hepatic lesion is visualized as a cold spot on the 64Cu-DOTA-trastuzumab scan. Liver SUV was 27.6 g/ml in Patient A compared with 5.5 g/ml in Patient B, for whom hepatic lesions are dramatically visualized as hot spots. For Patient B, note that 2 lesions not seen with 18F-FDG are detected with 64Cu-DOTA-trastuzumab.

