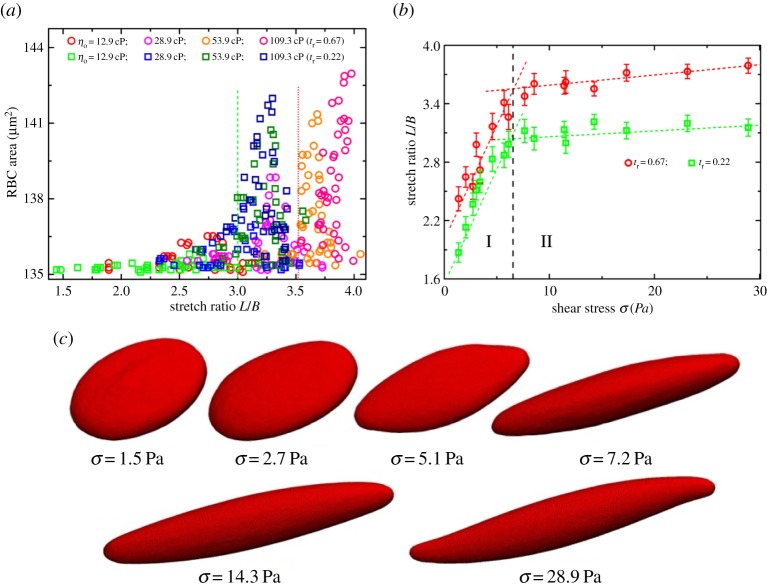
Figure 10.
(a) Surface area of a RBC versus the stretching ratio L/B. The dashed and dotted lines show the boundary between regimes I and II at tr=0.67 and 0.22, respectively. (b) Stretch ratio L/B versus shear stress σ. The dashed line divides the system into two regimes. (c) Shape deformation of a RBC at different shear stresses σ. (Online version in colour.)

